Введение в сетевой анализ
“
Почему сеть так медленно работает?” “Почему у меня нет доступа к e-mail?” “
Почему я не могу расшарить диск ?” “
Почему мой компьютер ведет себя странно ?”
Если вы системный администратор, или специалист по сетям , то вы много раз слышали такие вопросы.
Обычно такие вопросы являются толчком к решению сетевых проблем.
Сначала вы начинаете со своего компьютера.
Затем вы переключаетесь на локальную сеть и начинаете проверять сервера и роутеры.
Нормально ли работают сетевые карты ?
Иногда приходится заниматься конфигурацией портов.
С помощью сетевого анализатора вы видите на экране тысячи датаграмм User Datagram Protocol (UDP) packets .
Вы ставите фильтр для блокировка какого-то порта и приходящих на него пакетов.
Вы быстро разобрались с проблемой и устранили ее источник благодаря использованию сетевого анализатора.
Что такое сетевой анализ и сниффинг ?
Network analysis is the process of capturing network traffic and inspecting it closely to determine what is happening on the network. A network analyzer decodes, or dissects, the data packets of common protocols and displays the network traffic in human-readable format. Network analysis is also known by several other names: traffic analysis, protocol analysis, sniffing, packet analysis, and eavesdropping to name a few. Sniffing tends to be one of the most popular terms in use today. However, as you will see later in this chapter, due to malicious users it has had a negative connotation in the past.
A network analyzer can be a standalone hardware device with specialized software, or it can simply be software that you install on your desktop or laptop computer. Network analyzers are available both free and commercially. Differences between network analyzers tend to depend on features such as the number of supported protocol decodes, the user interface, and graphing and statistical capabilities. Other differences include inference capabilities, such as expert analysis features, and the quality of packet decodes. Although several network analyzers all decode the same protocols, some may decode better than others.
| Note |
Sniffer (with a capital “S”) is a trademark owned by Network Associates referring to its Sniffer product line. However, it has become common industry usage that a “sniffer” (with a lower case “s”) is a program that captures and analyzes network traffic.
|
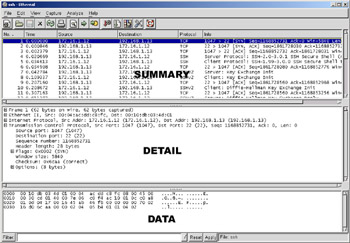
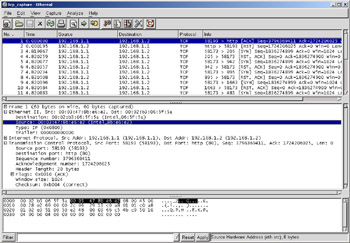
Figure 1.1 shows the Ethereal Network Analyzer display windows. A typical network analyzer displays the captured traffic in three panes:
-
Summary This pane displays a one line summary of the capture. Fields usually include date, time, source address, destination address, and the name and information about the highest-layer protocol.
-
Detail This pane provides all of the details for each of the layers contained inside the captured packet in a tree-like structure.
-
Data This pane displays the raw captured data both in hexadecimal and ASCII format.
A network analyzer is a combination of hardware and software. Although there are differences in each product, a network analyzer is composed of five basic parts:
-
Hardware Most network analyzers are software-based and work with standard operating systems (OSs) and network interface cards (NICs). However, there are some special hardware network analyzers that offer additional benefits such as analyzing hardware faults including: Cyclic Redundancy Check (CRC) errors, voltage problems, cable problems, jitter, jabber, negotiation errors, etc. Some network analyzers only support Ethernet or wireless adapters, while others support multiple adapters and allow users to customize their configuration. Sometimes you will also need a hub or a cable tap to connect to the existing cable.
-
Capture driver This is the part of a network analyzer that is responsible for actually capturing the raw network traffic from the cable. It will also filter out the traffic that you want and store the data in a buffer. This is the core of a network analyzer and you cannot capture data without it.
-
Buffer This component stores the captured data. Data can be stored in a buffer until it is full, or in a rotation method such as “round robin” where the newest data replaces the oldest data. Buffers can be disk-based or memory-based.
-
Real-time analysis This feature analyzes the data as it comes off the cable. Some network analyzers use this to find network performance issues, and network intrusion detection systems do this to look for signs of intruder activity.
-
Decode This component displays the contents of the network traffic with descriptions so that it is human-readable. Decodes are specific to each protocol, so network analyzers tend to vary in the number of decodes they currently support. However, new decodes are constantly being added to network analyzers.
| Note |
Jitter is a term used to describe the random variation in the timing of a signal. Electromagnetic interference and crosstalk with other signals can cause jitter. Jabber is when a device is improperly handling electrical signals, thus affecting the rest of the network. Faulty network interface cards can cause jabber.
|
Кто использует сетевой анализ ?
System administrators, network engineers, security engineers, system operators, even programmers, all use network analyzers. Network analyzers are invaluable tools for diagnosing and troubleshooting network problems. Network analyzers used to be dedicated hardware devices that were very expensive. New advances in technology have allowed for the development of software network analyzers. This makes it more convenient and affordable for administrators to effectively troubleshoot a network. It also brings the capability of network analysis to anyone who wishes to perform it.
The art of network analysis is a double-edged sword. While network, system, and security professionals use it for troubleshooting and monitoring of the network, intruders can also use network analysis for harmful purposes. A network analyzer is a tool, and like all tools they can be used for both good and bad intentions.
The following list describes a few reasons why administrators use network analyzers:
-
Converting the binary data in packets to human-readable format
-
Troubleshooting problems on the network
-
Analyzing the performance of a network to discover bottlenecks
-
Network intrusion detection
-
Logging network traffic for forensics and evidence
-
Analyzing the operations of applications
-
Discovering a faulty network card
-
Discovering the origin of a Denial of Service (DoS) attack
-
Detecting spyware
-
Network programming to debug in the development stage
-
Detecting a compromised computer
-
Validating compliance with company policy
-
As an educational resource when learning about protocols
-
For reverse-engineering protocols in order to write clients and supporting programs
How are Intruders Using Sniffers?
When used by malicious individuals, sniffers can represent a significant threat to the security of your network. Network intruders often use network sniffing to capture valuable, confidential information. The terms sniffing and eavesdropping have often been associated with this practice. However, sniffing is now becoming a non-negative term and most people use the terms sniffing and network analysis interchangeably.
Using a sniffer in an illegitimate way is considered a passive attack. It does not directly interface or connect to any other systems on the network. However, the computer that the sniffer is installed on could have been compromised using an active attack. The passive nature of sniffers is what makes detecting them so difficult. We will discuss the methods used to detect sniffers later in this chapter.
The following list describes a few reasons why intruders are using sniffers on the network:
-
Capturing clear-text usernames and passwords
-
Compromising proprietary information
-
Capturing and replaying Voice over IP telephone conversations
-
Mapping a network
-
Passive OS fingerprinting
Obviously, these are illegal uses of a sniffer, unless you are a penetration tester whose job it is to find these types of weaknesses and report them to an organization.
For sniffing to occur, an intruder must first gain access to the communication cable of the systems that are of interest. This means being on the same shared network segment, or tapping into the cable somewhere between the path of communications. If the intruder is not physically present at the target system or communications access point, there are still ways to sniff network traffic. These include:
-
Breaking into a target computer and installing remotely controlled sniffing software.
-
Breaking into a communications access point, such as an Internet Service Provider (ISP) and installing sniffing software.
-
Locating/finding a system at the ISP that already has sniffing software installed.
-
Using social engineering to gain physical access at an ISP to install a packet sniffer.
-
Having an insider accomplice at the target computer organization or the ISP install the sniffer.
-
Redirecting communications to take a path that includes the intruder’s computer.
Sniffing programs are included with most rootkits that are typically installed on compromised systems. Rootkits are used to cover the tracks of the intruder by replacing commands and utilities and clearing log entries. They also install other programs such as sniffers, key loggers, and backdoor access software. Windows sniffing can be accomplished as part of some RAT (Remote Admin Trojan) such as SubSeven or Back Orifice. Often intruders will use sniffing programs that are configured to detect specific things, such as passwords, and then electronically send them to the intruder (or store them for later retrieval by the intruder). Vulnerable protocols for this type of activity include telnet, FTP, POP3, IMAP, SMTP, HTTP, rlogin, and SNMP.
One example of a rootkit is T0rnKit, which works on Solaris and Linux. The sniffer that is included with this rootkit is called t0rns and is installed in the hidden directory /usr/srec/.puta. Another example of a rootkit is Lrk5 (Linux Rootkit 5), which installs with the linsniff sniffer.
Intruders commonly use sniffer programs to control back doors. One method is to install a sniffer on a target system that listens for specific information. Then, backdoor control information can be sent to a neighboring system. The sniffer picks this up, and acts appropriately on the target computer. This type of backdoor control is often hard for investigators to detect, since it looks like the innocent neighbor system is the compromised target. cd00r is an example of a backdoor sniffer that operates in non-promiscuous mode, making it even harder to detect. Using a product like Nmap to send a series of Transmission Control Protocol (TCP) SYN packets to several predefined ports will trigger the backdoor to open up on a pre-configured port. More information about Cdoor can be found at www.phenoelit.de/stuff/cd00r.c.
| Note |
A rootkit is a collection of trojan programs that are used to replace the real programs on a compromised system in order to avoid detection. Some common commands that get replaced are ps, ifconfig, and ls. Rootkits also install additional software such as sniffers.
|
| Note |
Nmap is a network scanning tool used for network discovery and auditing. It can send raw IP packets to destination ports on target systems.
|
What does Sniffed Data Look Like?
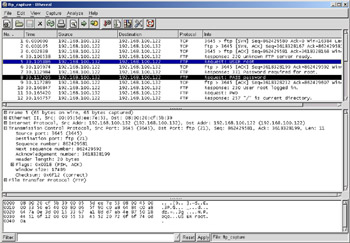
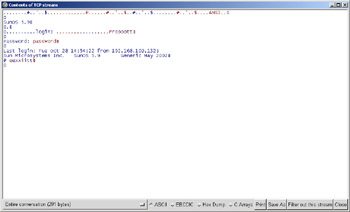
We have done a lot of talking about sniffers and what they are used for, but the easiest way to grasp the concepts previously discussed is watching a sniffer in action. Figure 1.2 shows a capture of a simple FTP session from a laptop to a Sun Solaris system. The two highlighted packets show you just how easy it is to sniff the username and password. In this case, the username is “root” and the password is “password”. Of course, allowing root to FTP into a system is a very poor security practice; this is just for illustration purposes!
Common Network Analyzers
A simple search on SecurityFocus (www.securityfocus.org/tools/category/4) shows the diversity and number of sniffers available. Some of the most prominent ones are:
-
Ethereal Of course, this one is the topic of this book! Ethereal is obviously one of the best sniffers available. It is being developed as a free commercial quality sniffer. It has numerous features, a nice graphical user interface (GUI), decodes for over 400 protocols, and it is actively being developed and maintained. It runs on both UNIX-based systems and Windows. This is a great sniffer to use, even in a production environment. It is available at www.ethereal.com.
-
WinDump This is the Windows version of tcpdump available at http://windump.polito.it. It uses the WinPcap library and runs on Windows 95/98/ME/NT/2000/XP.
-
Network Associates Sniffer This is one of the most popular commercial products available. Now marketed under McAfee Network Protection Solutions, Network Associates has an entire Sniffer product line for you to peruse at www.nai.com.
-
Windows 2000/NT Server Network Monitor Both Windows 2000 Server and NT Server have a built-in program to perform network analysis. It is located in the Administrative tools folder, but is not installed by default, so you may have to add it from the installation CD.
-
EtherPeek This is a commercial network analyzer by WildPackets. There are versions for both Windows and Mac, as well as other network analysis products that can be found at www.wildpackets.com.
-
Tcpdump This is the oldest and most common network sniffer. The Network Research Group (NRG) of the Information and Computing Sciences Division (ICSD) at Lawrence Berkeley National Laboratory (LBNL) developed tcpdump. It is command line-based and runs on UNIX-based systems. It is being actively developed and maintained at www.tcpdump.org.
-
Snoop This command line network sniffer is included with the Sun Solaris operating system. It is especially competent at decoding Sun-specific protocols.
-
Sniffit This network sniffer runs on Linux, SunOS, Solaris, FreeBSD and IRIX. It is available at http://reptile.rug.ac.be/~coder/sniffit/sniffit.html.
-
Snort This is a network intrusion detection system that uses network sniffing. It is actively developed and maintained at www.snort.org. For more information, refer to Snort 2.0:Intrusion Detection (Syngress Publishing, ISBN: 1-931836-74-4)
-
Dsniff This is very popular network sniffing package. It is a collection of programs to sniff specifically for interesting data such as passwords, and to facilitate the sniffing process such as evading switches. It is actively maintained at www.monkey.org/~dugsong/dsniff.
-
Ettercap This sniffer is designed specifically to sniff in a switched network. It has built-in features such as password collecting, OS fingerprinting, and character injection. It runs on several platforms including Linux, Windows, and Solaris. It is actively maintained at http://ettercap.sourceforge.net.
-
Analyzer This is a free sniffer for the Windows OS that is being actively developed by the makers of WinPcap and WinDump at
-
Politecnico di Torino. It can be downloaded from http://analyzer.polito.it.
-
Packetyzer This is a free sniffer for the Windows OS that uses Ethereal’s core logic. It tends to run a version or two behind the current release of Ethereal. It is actively maintained by Network Chemistry at www.networkchemistry.com/products/packetyzer/index.html.
How Does It Work?
This section provides an overview of how all of this sniffing takes place. It gives you a little background on how networks and protocols work; however, there are many excellent resources out there that fill entire books themselves! The most popular and undoubtedly one of the best resources is Richard Stevens’ “TCP/IP Illustrated, Vol. 1 – 3”.
Explaining Ethernet
Ethernet is the most popular protocol standard used to enable computers to communicate. A protocol is like speaking a particular language. Ethernet was built around a principle of a shared medium where all computers on the local network segment share the same cable. It is known as a broadcast protocol because when a computer has information to send, it sends that data out to all other computers on the same network segment. This information is divided up into manageable chunks called packets. Each packet has a header, which is like an envelope containing the addresses of both the destination and source computers. Even though this information is sent out to all computers on a segment, only the computer with the matching destination address will respond. All of the other computers on the network still see the packet, but if they are not the intended receiver they will disregard and discard it, unless a computer is running a sniffer. When you are running a sniffer, the packet capture driver that we mentioned earlier will put the computer’s NIC into what is known as promiscuous mode. This means that the sniffing computer will be able to see all of the traffic on the segment regardless of who it is being sent to. Normally computers run in non-promiscuous mode, listening for information only designated for themselves. However, when a NIC is in promiscuous mode it can see conversations to and from all of its neighbors.
Ethernet addresses are known as Media Access Control (MAC) addresses, hardware addresses, or sometimes just Ethernet addresses. Since many computers may share a single Ethernet segment, each must have an individual identifier. These identifiers are hard-coded on to the NIC. A MAC address is a 48-bit number, also stated as a 12-digit hexadecimal number. This number is broken down into two halves, the first 24-bits identify the vendor of the Ethernet card, and the second 24-bits is a serial number assigned by the vendor.
The following steps will allow you to view your NIC’s MAC address:
-
Windows 9x Access Start | Run, and type winipcfg.exe. The MAC address will be listed as “Adapter Address”.
-
Windows NT/2000/XP Access the command line and type ipconfig /all. The MAC address will be listed as “Physical Address”.
-
Linux and Solaris Type ifconfig –a at the command line. The MAC address will be listed as “HWaddr” on Linux and “ether” on Solaris.
You can also view the MAC addresses of other computers that you have communicated with recently, by using the command arp –a. More will be discussed about this in the “Defeating Switches” section.
MAC addresses are unique, and no two computers should have the same one. However, this is not always the case. Occasionally there could be a manufacturing error that would cause more than one network interface card to have the same MAC address, but mostly, people will change their MAC addresses on purpose. This can be done with a program, such as ifconfig, that will allow you to fake your MAC address. Faking your MAC address is also called spoofing. Also, some adapters allow you to use a program to reconfigure the runtime MAC address. And lastly with the right tools and skill you can physically re-burn the address into the network interface card.
| Note |
Spoofing is the altering of network packet information such as the IP source address, MAC address, or even an e-mail address. This is often done to masquerade as another device in order to exploit a trust relationship, or to make tracing the source of attacks difficult. Address spoofing is also used in denial of service (DoS) attacks, such as Smurf, where the return address of network requests are spoofed to be the IP address of the victim.
|
Understanding the OSI model
The International Standards Organization (ISO) developed the Open Systems Interconnection (OSI) model in the early 1980’s to describe how network protocols and components work together. It divides network functions into seven layers, and each layer represents a group of related specifications, functions, and activities.
The layers of the OSI model are:
-
Application layer This topmost layer of the OSI model is responsible for managing communications between network applications. This layer is not the application program itself, although some applications may have the ability and the underlying protocols to perform application layer functions. For example, a Web browser is an application, but it is the underlying Hypertext Transfer Protocol (HTTP) protocol that provides the application layer functionality. Examples of application layer protocols include File Transfer Protocol (FTP), Simple Network Management Protocol (SNMP), Simple Mail Transfer Protocol (SMTP), and Telnet.
-
Presentation layer This layer is responsible for data presentation, encryption, and compression.
-
Session layer The session layer is responsible for creating and managing sessions between end systems. The session layer protocol is often unused in many protocols. Examples of protocols at the session layer include NetBIOS and Remote Procedure Call (RPC).
-
Transport layer This layer is responsible for communication between programs or processes. Port or socket numbers are used to identify these unique processes. Examples of transport layer protocols include: TCP, UDP, and Sequenced Packet Exchange (SPX).
-
Network layer This layer is responsible for addressing and delivering packets from the source computer to the destination computer. The network layer takes data from the transport layer and wraps it inside a packet or datagram. Logical network addresses are generally assigned to computers at this layer. Examples of network layer protocols include IP and Internetwork Packet Exchange (IPX). Devices that work at this layer are routers and Layer 3 switches.
-
Data link layer This layer is responsible for delivering frames between NICs on the same physical segment. Communication at the data link layer is generally based on MAC addresses. The data link layer wraps data from the network layer inside a frame. Examples of data link layer protocols include Ethernet, Token Ring, and Point-to-Point Protocol (PPP). Devices that operate at this layer include bridges and switches.
-
Physical layer This layer defines connectors, wiring, and the specifications on how voltage and bits pass over the cabled or wireless media. Devices at this layer include repeaters, concentrators, hubs, and cable taps. Devices that operate at the physical layer do not have an understanding of network paths.
| Note |
The terms frame and packet tend to be used interchangeably when talking about network traffic. However, the difference lies in the various layers of the OSI model. A frame is a unit of transmission at the data link layer. A packet is a unit of transmission at the network layer, however many people use the term packet to refer to data at any layer.
|
The OSI model is very generic and can be used to explain virtually any network protocol. Various protocol suites are often mapped against the OSI model for this purpose. A solid understanding of the OSI model aids tremendously in network analysis, comparison, and troubleshooting. However, it is also important to remember that not all protocols map nicely to the OSI model. For example, TCP/IP was designed to map to the U.S. Department of Defense (DoD) model. In the 1970s, the DoD developed its four-layer model. The core Internet protocols adhere to this model.
The DoD model is merely a condensed version of the OSI model. Its four layers are:
-
Process layer This layer defines protocols that implement user-level applications such as mail delivery, remote login, and file transfer.
-
Host-to-host layer This layer handles the connection, data flow management, and retransmission of lost data.
-
Internet layer This layer is responsible for delivering data from source host to destination host across a set of different physical networks that connect the two machines.
-
Network access layer This layer handles the delivery of data over a particular hardware media.
 Bytes received :::    48
 Source address ::: 192.168.1.1
 IP header length ::: 5
 Protocol ::: 6
 Source port ::: 1372
 Dest port  ::: 23
 Bytes received :::    48
 Source address ::: 192.168.1.1
 IP header length ::: 5
 Protocol ::: 6
 Source port ::: 1374
 Dest port  ::: 21
Once you are done capturing data, you can end the program by typing CTRL-C. You may also want to remove your interface from promiscuous mode by typing the command ifconfig eth0 –promisc.
CSMA/CD
Ethernet uses the Carrier Sense Multiple Access/Collision Detection (CSMA/CD) protocol for devices on the network to exchange data. The term multiple access refers to the fact that many network devices attached to the same segment have the opportunity to transmit. Each device is given an equal opportunity; no device has priority over any other. Carrier sense describes how an Ethernet interface on a network device listens to the cable before transmitting. The network interfacer ensures that there are no other signals on the cable before it transmits. An Ethernet interface also listens while transmitting to ensure that no other network device transmits data at the same time. When two network devices transmit at the same time, a collision occurs. Since Ethernet interfaces listen to the media while they are transmitting, they are able to identify the presence of others through their collision detection method. If a collision occurs, the transmitting device will wait a random amount of time before retransmitting. This function is known as random backoff.
Traditionally, Ethernet operation has been half duplex. This means that an interface may either transmit or receive data, but it cannot do both at the same time. If more than one network interface on a segment tries to transmit at the same time, a collision occurs, as per CSMA/CD. When a crossover cable is used to connect two devices or a single device is attached to a switch port, only two interfaces on the segment need to transmit or receive and no collisions occur. This is because the transmit (TX) of device A is connected to the receive (RX) of device B, and the TX of B is connected to the RX of A. The collision detection method is therefore no longer necessary, so interfaces can be placed in full-duplex mode of operation. This mode allows network devices to transmit and receive at the same time, thereby increasing performance.
Hardware: Taps, Hubs, and Switches, Oh My!
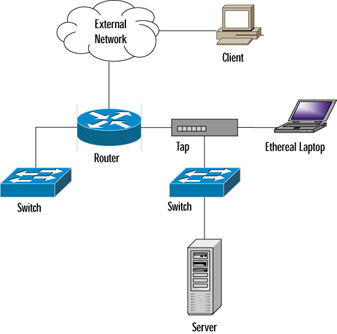
Cable taps are hardware devices that assist in connecting to the network cable. Tap stands for Test Access Point, and you can use this device to access any cable between computers, hubs, switches, routers, and other devices. Taps are available in full or half-duplex for 10, 100, and 1000 Mbps Ethernet links. They are also available in various multi-port sizes. Following is a list of some popular cable tap products:
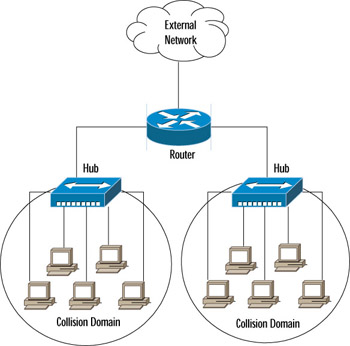
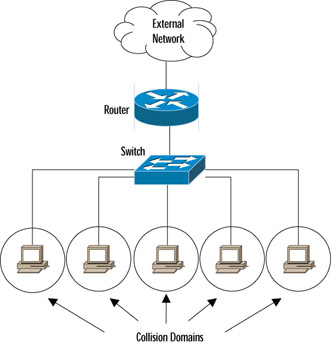
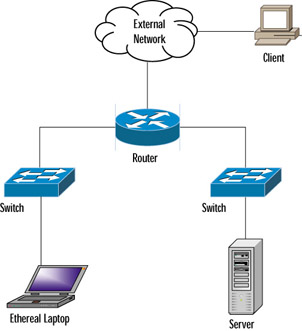
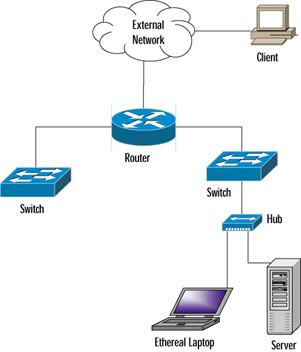
A hub is a device that allows you to connect multiple hosts together on a shared medium, such as Ethernet. When a computer sends information, it travels into the hub and the hub blindly forwards the information to all other computers connected to it. As we explained before with Ethernet, the computer that the information was intended for will recognize its own MAC address in the packet header and then accept the data. The area that the hub forwards all information to is known as a collision domain, or broadcast domain. A hub has only one collision domain for all of the traffic to share. Figure 1.4 shows a network architecture with collision domains related to hubs. Large collision domains not only makes sniffing easier, but also create performance issues like bandwidth hogging or excessive traffic on the hub.
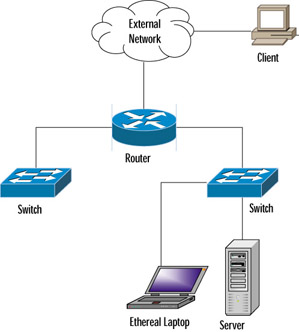
A switch operates very differently from a hub. It is also used to connect computers together on a shared medium; however, when a switch receives information from a computer it doesn’t just blindly send it to all other computers. A switch will actually look at the packet header to locate the destination MAC address. A switch maintains a list of all MAC addresses and corresponding ports on the switch that the computers are connected to. It will then forward the packets to the specified port. This narrows the collision domain, or broadcast domain to a single port, as shown in Figure 1.5. This type of collision domain will also provide a definite amount of bandwidth for each connection rather than a shared amount on a hub. Since the price of switches has fallen dramatically in the last few years, there is no reason to not replace hubs with switches, or to choose switches when purchasing new equipment. Also, some of the more costly switches often include better technology to make them more resistant to sniffing attacks.
As you can see from the diagrams, hubs make sniffing easier, and switches make it more difficult. However, switches can be tricked, as discussed in the “Defeating Switches” section.
Port Mirroring
What if you are working in a network that uses switches and you want to perform network analysis legitimately? You are in luck, as most switches and routers come with a feature known as port mirroring, or port spanning. To mirror ports, you need to configure the switch to duplicate the traffic from a port you want to monitor to a port you are connected to with your network analyzer. This feature was designed just for this purpose, to analyze network traffic for troubleshooting.
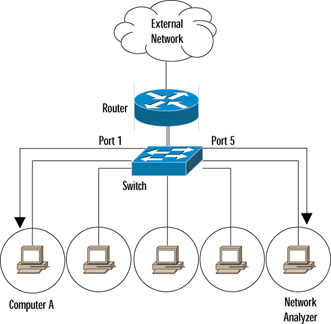
Using port spanning does not interfere with the normal operation of switches, but you always want to check the documentation of the exact switch you are configuring and periodically check the device’s logs. You won’t affect the switch, but you will increase the amount of traffic on a specific destination port, so make sure your properly configured network analyzer is the destination port. Please consult the documentation for your specific switch to learn the exact command to enable port mirroring. Figure 1.6 shows the process of port mirroring. The switch is configured to mirror all port 1 traffic to port 5. The network analyzer will see any traffic to and from Computer A. Sometimes administrators will mirror the uplink port on a switch; that way they will see all traffic to and from the switch and all of its ports.
| Note |
Span means Switched Port ANalyzer. Cisco uses the word span to describe the concept of port mirroring. To span a port in Cisco terms is the same as mirroring a port.
|
Defeating Switches
We mentioned earlier that the use of switches in your network makes sniffing more difficult. In theory, on a switch you should only see traffic destined for you own computer. Notice we didn’t say that switching eliminates sniffing. There are ways to trick a switch, or to get around its technology. The following list describes several ways in which a switch can be defeated:
-
Switch Flooding Some switches can be made to act like a hub, where all packets are broadcast to all computers. This can be accomplished by overflowing the switch address table with all kinds of fake MAC addresses. This is known as a device failing open, thus removing all security provisions. Devices that fail close will incorporate some sort of security measure, such as shutting down all communications. The Dsniff package comes with a program called macof that is designed to perform switch MAC address flooding. It can be downloaded from http://monkey.org/~dugsong/dsniff.
-
ARP Redirects When a computer needs to know the MAC address of another computer, it will send an ARP request. Each computer maintains an ARP table to store the MAC addresses of other computers that it has talked to. ARPs are broadcast on a switch, so all computers on that switch will see the request and the response. There are several methods that use ARP to trick a switch into sending traffic somewhere it shouldn’t. First, an intruder can subvert a switch by sending out an ARP claiming to be someone else as the MAC address. An intruder can also send an ARP claiming to be the router, in which case computers will try to send their packets through the intruder’s computer. Or, an intruder can send an ARP request just to one victim, claiming to be the router, at which point the victim will start forwarding packets to the intruder. All of these tricks will allow an intruder to see information that he/she is not supposed to see.
-
ICMP Redirect Sometimes computers are on the same physical segment, the same switch, but different logical segments. This means they are in different IP subnets. When Computer A wants to talk to Computer B it will send its request through a router. The router knows that they are on the same physical segment, so it will send an ICMP Redirect to Computer A letting it know that it can send its packets directly to Computer B. An intruder, Computer X, could send a fake ICMP redirect to Computer A, claiming that it should send Computer B’s packets to Computer X.
-
ICMP Router Advertisements These advertisements inform computers of who the router is. An intruder could send these types of advertisements out claiming to be the router, and computers will start to forward all packets through the intruder.
-
MAC Address Spoofing An intruder can pretend to be using a different computer by spoofing its MAC address. Sending out packets with the source address of the victim will trick the switch. The switch will enter the spoofed information into its table and begin sending packets to the intruder. But what about the victim, who is still on the switch and sending updates causing the switch to change the table back? This can be solved by taking the victim offline with some sort of DoS attack, then redirecting the switch and continuing with communications. The intruder could also broadcast out the traffic that he receives to ensure that the victim computer still receives the packets. Some switches have a countermeasure that will allow you to statically assign a MAC address to a port. This may be difficult to manage if you have a large network, but it will eliminate MAC spoofing.
To spoof your MAC on Linux or Solaris when you are connected locally, you can simply use ifconfig as follows:
ifconfig eth0 down
 ifconfig eth0 hw ether 00:02:b3:00:00:AA
 ifconfig eth0 up
Register the MAC on all hosts by broadcast ping (and use Control C to close the ping): ping -c 1 -b 192.168.1.255
Now you can sniff all traffic to the computer that owns this MAC address.
-
Reconfigure port spanning on the switch As we mentioned earlier, switch ports can be configured to see traffic destined for other ports. An intruder could perform this by connecting to the switch via Telnet or some other default backdoor. The intruder could also use SNMP if it is not secured.
-
Cable taps As mentioned earlier, cable taps can be used to physically tap into the cable. Tapping into the uplink cable on a switch will show you all of the traffic entering and exiting that switch.
There are many methods of defeating switches, but this is contingent upon how a switch operates. Not all of the methods discussed will work, especially with newer, more technologically savvy switches. The Dsniff FAQ contains some good information for sniffing in a switched environment. It can be located at http://monkey.org/~dugsong/dsniff/faq.html.
Detecting Sniffers
Remember earlier that we said sniffers are a form of passive attack. They don’t interact with any devices or transmit any information, thus making them very difficult to detect. Although tricky, detecting sniffers is possible. The easiest method is to check your network interfaces to see if they are in promiscuous mode. On UNIX-based systems the command ifconfig –a will list the network adapters on the system. Look for the PROMISC flag in the output, such as in the following example:
[root@localhost root]# ifconfig -a
 eth0      Link encap:Ethernet  HWaddr 00:02:B3:06:5F:5A
           inet addr:192.168.1.2  Bcast:192.168.1.255  Mask:255.255.255.0
           UP BROADCAST RUNNING PROMISC MULTICAST  MTU:1500  Metric:1
           RX packets:204 errors:0 dropped:0 overruns:0 frame:0
           TX packets:92 errors:0 dropped:0 overruns:0 carrier:0
           collisions:0 txqueuelen:100
           RX bytes:46113 (45.0 Kb)  TX bytes:5836 (5.6 Kb)
           Interrupt:11 Base address:0x1800 Memory:e8120000-e8120038
If ifconfig is not detecting a sniffer that you know is currently installed and in promiscuous mode, you can try using the ip link command, a handy TCP/IP interface configuration and routing utility. The following example shows the output from the ip command:
[root@localhost root]# ip link
 1: lo: <LOOPBACK,UP> mtu 16436 qdisc noqueue
     link/loopback 00:00:00:00:00:00 brd 00:00:00:00:00:00
 2: eth0: <BROADCAST,MULTICAST,PROMISC,UP> mtu 1500 qdisc pfifo_fast qlen 100
     link/ether 00:02:b3:06:5f:5a brd ff:ff:ff:ff:ff:ff
Detecting promiscuous mode on Windows systems is more difficult because there are no standard commands that will list that type of information. However, there is a free tool called PromiscDetect, developed by Arne Vidstrom, that will detect promiscuous mode network adapters for Windows NT, 2000, and XP. It can be downloaded from http://ntsecurity.nu/toolbox/promiscdetect. The following example shows the output of PromiscDetect, the D-link adapter is in normal operation mode, but the Intel adapter has Ethereal running on it:
C:\>promiscdetect
 PromiscDetect 1.0 - (c) 2002, Arne Vidstrom (arne.vidstrom@ntsecurity.nu)
                   - http://ntsecurity.nu/toolbox/promiscdetect/
 Adapter name:
  - D-Link DWL-650 11Mbps WLAN Card
 Active filter for the adapter:
  - Directed (capture packets directed to this computer)
  - Multicast (capture multicast packets for groups the computer is a member of)
  - Broadcast (capture broadcast packets)
 Adapter name:
  - Intel(R) PRO/100 SP Mobile Combo Adapter
 Active filter for the adapter:
  - Directed (capture packets directed to this computer)
  - Multicast (capture multicast packets for groups the computer is a member of)
  - Broadcast (capture broadcast packets)
  - Promiscuous (capture all packets on the network)
 WARNING: Since this adapter is in promiscuous mode there could be a sniffer
          running on this computer!
Unfortunately some sniffers can cover their tracks by hiding the promiscuous flags. Also, if the sniffer was installed on a compromised system by using a rootkit, the intruder has most likely replaced commands like ifconfig. The following list describes several other methods that could be used to detect sniffers on the network:
-
Monitor DNS reverse lookups. Some sniffers will perform DNS queries to resolve IP addresses to host names. Performing a network ping scan or pinging your entire network address space could trigger this activity.
-
Send TCP/IP packets to all IP addresses on the same Ethernet segment, but with fake MAC addresses. Normally the network interface card will drop packets with the wrong MAC address. However, some systems, when in promiscuous mode, will answer with a reset packet (RST). This may also work in a switched environment since switches forward broadcast packets that they don’t have MAC addresses listed for. Many newer sniffers have build in defenses for this technique by altering the way they handle MAC addresses.
-
Carefully monitor hub ports. Ideally you would have a network diagram and your cables would be labeled. Then, if something unusual appeared, such as a new device or a newly active hub port, you would recognize it. However, in reality, wiring closets and cabling can be a nightmare. If your hubs are being monitored with a protocol such as SNMP via a network management system, you may be able to use this information to detect any unusual connects and disconnects.
-
Remember how ARP is used to link IP addresses to MAC addresses. Normally an ARP is sent out as a broadcast to everyone. However, you could send out an ARP to a non-broadcast address, followed by a broadcast ping. No one should have your information in his or her ARP table except the sniffer because it was listening to all traffic, even the non-broadcast traffic. Therefore the computer with the sniffer would respond.
-
Use a honeypot. A honeypot is a server that is set up to monitor the activity of intruders. It contains fake data and services. In this case you could create fake administrator or user accounts on the honeypot and then create connections across the network to it using clear text protocols such as Telnet or FTP. If there are sniffers monitoring for user names and passwords they will see the honeypot and the intruder will eventually try to log into it. Honeypots run intrusion detection software to monitor activity, and special signatures can be added to trigger alerts when the fake accounts are used.
-
Carefully monitor your hosts. This includes disk space, CPU utilization, and response times. Sniffers gradually consume disk space each day as they log traffic, and they can sometimes put a noticeable load on the CPU. When the infected computer’s resources become consumed it will respond more slowly than normal.
There are several tools that can be used to detect sniffers on your network. Many of them are outdated and no longer actively maintained, and sometimes just hard to find. Also, newer sniffers have been rewritten to evade their detection. However, we want to take a moment to mention some of them.
-
PromiScan Ver 0.27 This is a free program by Security Friday that is up-to-date and actively maintained. It runs on Windows 2000 and XP and requires the WinPcap driver. It can scan the local network looking for remote promiscuous mode adapters, using ARP packets. It can be downloaded from www.securityfriday.com/ToolDownload/_PromiScan/promiscan_doc.html.
-
AntiSniff This program was originally written by L0pht, but is no longer supported or maintained. Archived Windows and UNIX versions can be downloaded from http://packetstormsecurity.nl/sniffers/antisniff.
-
Sentinel This free program performs remote promiscuous detection, and runs on various versions of BSD and Linux. It requires the libpcap and libnet libraries to operate. It can be downloaded from www.packetfactory.net/projects/sentinel.
-
Neped Network Promiscuous Ethernet Detector is a free UNIX-based program originally written by the Apostols Group to remotely detect promiscuous mode network interface cards on Linux computers. It only detects on a subset of Linux systems with unpatched kernels before version 2.0.36. The Apostols website no longer exists and neped can be difficult to find. Currently there is a version located at www.dsinet.org/tools/network-sniffers/neped.c.
-
Check Promiscuous Mode (CPM) This is a free UNIX-based program developed by CERT/CC in response to increased network sniffing. More information, including the program, can be obtained from www.cert.org/advisories/CA-1994-01.html.
-
Ifstatus This is a free UNIX-based program to detect promiscuous mode interfaces on Solaris and AIX systems. It can be downloaded from ftp://ftp.cerias.purdue.edu/pub/tools/unix/sysutils/ifstatus.
-
Promisc.c This is a free UNIX-based program to detect promiscuous mode interfaces on Linux and some SunOS systems. It can be downloaded from www.dsinet.org/tools/network-sniffers/promisc.c.
Protecting Against Sniffers
So far you have learned what sniffing is and how it works. You have also learned some of the tricks that can be used by intruders to sniff where they aren’t supposed to, and some not-so-foolproof methods of detecting sniffers. None of this sheds much of a positive light on your plight to protect your network and data. Fortunately there are some methods that you can use on your network that offer protection against the passive attack known as sniffing.
We talked earlier about using switches on your network instead of hubs. However, we also learned the methods used to defeat switches. Using switches is a network best practice that will allow increased performance and security that should be used regardless of existing methods to evade them. While switches will present a barrier to casual sniffing, the best method of protecting your data is encryption. Encryption is the best form of protection against traffic interception, on public networks as well as your own internal networks. Intruders will still be able to sniff the traffic, but the data will appear unreadable. Only the intended recipient should be able to decrypt and read the data. Some methods of encryption still leave the headers in cleartext, so the intruder will be able to see the source and destination addresses and possibly map the network, but the data will be obscured. Other forms of encryption will also mask the header portion of the packet.
A virtual private network (VPN) uses encryption and authentication to provide secure communications over an otherwise insecure network. VPNs protect the transmission of data over the Internet, and even your internal network. However, if an intruder compromises either of the end nodes of a VPN, the protection is rendered useless. The following list describes some of the VPN methods in use today that will protect your data against sniffing:
-
Secure Shell (SSH) SSH is an application-level VPN that runs over TCP to secure client-to-server transactions. This is often used for general logins and to administer servers remotely. It is typically used to replace Telnet, FTP, and Berkley Services “r” commands. However, since any arbitrary TCP protocol can be tunneled through an SSH connection, it can be used for numerous other applications. SSH provides authentication by RSA or DSA asymmetric key pairs. The headers in an SSH session are not encrypted, so an intruder will still be able to view the source and destination addresses.
-
Secure Sockets Layer (SSL)/Transport Layer Security (TLS) SSL was originally developed by Netscape Communications to provide security and privacy to Internet sessions. It has been replaced by TLS as stated in RFC 2246. TLS provides security at the transport layer and overcomes some security issues of SSL. It is used to encapsulate the network traffic of higher-level applications such as LDAP, HTTP, FTP, NNTP, POP3, and IMAP. It provides authentication and integrity via digital certificates and digital signatures.
-
IP Security (IPSec) IPSec is a network-level protocol that incorporates security into the IPv4 and IPv6 protocols directly at the packet level by extending the IP packet header. This allows the ability to encrypt any higher layer protocol. It is currently being incorporated into routing devices, firewalls, and clients for securing trusted networks to one another. IPSEC provides several means for authentication and encryption, supporting quite a few public key authentication ciphers and symmetric key encryption ciphers. It can operate in tunnel mode to provide a new IP header that will mask the original source and destination addresses.
One-time passwords (OTP) is another method to protect against sniffing. S/key, One-time Passwords In Everything (OPIE), and other one-time password techniques will protect against the collection and reuse of passwords. They operate by using a challenge-response method, and a different password is transmitted each time authentication is needed. The passwords that a sniffer collects will be useless since they are only used once. Smart cards are a popular method of implementing one-time passwords.
E-mail protection is a hot topic for both companies and individuals. Two methods of protecting e-mail, by encrypting it in transit and in storage, are Pretty Good Privacy (PGP) and Secure Multipurpose Internet Mail Extensions (S/MIME). Each of these methods also provides authentication and integrity by the use of digital certificates and digital signatures.
Network Analysis and Policy
There is one very important topic that we would like to take time to address. Before cracking open your newly installed network analyzer at work, please read your company policy! A properly written and comprehensive “Appropriate Use” network policy will more than likely prohibit you from running network analyzers. Usually the only exception to this is if network analysis is in your job description. Also, just because you may provide security consulting services for company clients, does not mean that you can use your sniffer on the company network. However, if you are an administrator and are allowed to legitimately run a sniffer, you can use it to enforce your company’s security policy. If your security policy prohibits the use of file sharing applications such as KaZaA, Morpheus, or messaging services such as Internet Relay Chat (IRC) or Instant Messenger, you could use your sniffer to detect this type of activity.
Also, if you provide security services for clients, such as an ethical hacker who performs penetration testing, be sure that the use of a sniffer is included in your Rules of Engagement. Be very specific about how, where, and when it will be used. Also provide clauses, such as Non-Disclosure Agreements, that will exempt you from the liability of learning confidential information.
Another word of caution: many ISPs prohibit the use of sniffers in their “Appropriate Use” policy. If they discover that you are using one while attached to their network, they may disconnect your service. The best place to experiment with a sniffer is on your own home network that is not connected to the Internet. All you really need is two computers with a crossover cable between them. You can use one as a client, and install server services on the other, such as Telnet, FTP, Web, and mail. Install the sniffer on one or both computers and have fun!
| Note |
You can also download packet traces from numerous websites and read them with your network analyzer to get used to analyzing and interpreting packets. The HoneyNet Project at http://project.honeynet.org has monthly challenges and other data for analysis.
|
Summary
Network analysis is the key to maintaining an optimized network and detecting security issues. Proactive management can help find issues before they turn into serious problems and cause network downtime or compromise confidential data. In addition to identifying attacks and suspicious activity, you can use your network analyzer data to identify security vulnerabilities and weaknesses and enforce your company’s security policy. Sniffer logs can be correlated with IDS, firewall, and router logs to provide evidence for forensics and incident handling. A network analyzer allows you to capture data from the network, packet by packet, decode the information, and view it in an easy to understand format. Network analyzers are easy to find, often free, and easy to use; they are a key part of any administrator’s toolbox.
We covered the basics of networking, Ethernet, the OSI model, and hardware that is used in a network architecture. Believe me, we only scratched the surface here. A good networking and protocols reference should be on every administrator’s bookshelf. This will come in very handy when you discover some unknown or unusual traffic on your network.
As an administrator, you should also know how to detect the use of sniffers by intruders. You should keep up to date on the methods that intruders use to get around security measures that are meant to protect against sniffing. As always, you will also need to make sure that your computer systems are up to date with patches and security fixes to protect against rootkits and other backdoors.
We also covered a variety of methods used to protect your data from eavesdropping by sniffers. You should always remain up to date on the latest security technologies, encryption algorithms, and authentication processes. Intruders are constantly finding ways to defeat current security practices, thus more powerful methods are developed. A good example is the cracking of the DES encryption scheme and its subsequent replacement with Triple Data Encryption Standard (3DES).
Finally, remember the rule of network analysis—only do it if you have permission. A happy, curious, up-and-coming administrator could easily be mistaken as an intruder. Make sure you have permission or use your own private network to experiment.
Solutions Fast Track
What is Network Analysis and Sniffing?
-
Network analysis is capturing and decoding network data.
-
Network analyzers can be hardware or software, and are available both free and commercially.
-
Network analyzer interfaces usually have three panes: summary, detail, and data.
-
The five parts of a network analyzer are: hardware, capture driver, buffer, real-time analysis, and decode.
Who Uses Network Analysis?
-
Administrators use network analysis for troubleshooting network problems, analyzing the performance of a network, and intrusion detection.
-
When intruders use sniffers, it considered is a passive attack.
-
Intruders use sniffers mostly to capture user names and passwords, collect confidential data, and map the network.
-
Sniffers are a common component of a rootkit.
-
Intruders are using sniffers to control backdoor programs.
How Does it Work?
-
Ethernet is a shared medium that uses MAC, or hardware, addresses.
-
The OSI model has seven layers and represents a standard for network communication.
-
Hubs send out information to all hosts on the segment, creating a shared collision domain.
-
Switches have one collision domain per port and keep an address table of the MAC addresses that are associated with each port.
-
Port mirroring is a feature that allows you to sniff on switches.
-
Switches make sniffing more difficult, however the security measures in switch architectures can be overcome by a number of methods, thus allowing the sniffing of traffic designated for other computers.
Detecting Sniffers
-
Sometimes sniffers can be detected on local systems by looking for the promiscuous mode flag.
-
There are several tools available that attempt to detect promiscuous mode by using various methods.
-
Carefully monitoring your hosts, hub and switch ports, and DNS reverse lookups can assist in detecting sniffers.
-
Honeypots are a good method to detect intruders on your network who are attempting to use compromised passwords.
-
Newer sniffers are smart enough to hide themselves from traditional detection techniques.
Protecting Against Sniffers
-
Switches offer some, but little protection against sniffers.
-
Encryption is the best method of protecting your data from sniffers.
-
SSH, SSL/TLS, and IPSEC are all forms of VPNs that operate at various layers of the OSI model.
-
IPSec tunnel mode can protect the source and destination addresses in the IP header by appending a new header.
Network Analysis and Policy
-
Make sure you have permission to use a sniffer on a network that is not your own.
-
Read the appropriate use policies of your ISPs before using a sniffer.
-
If you are hired to assess a computer network, and plan to use a sniffer, make sure you have some sort of non-disclosure agreements in place, because you may have access to confidential data.
-
One-time passwords render compromised passwords useless.
-
E-mail should be protected while in transit and storage with some type of data encryption method.
Frequently Asked Questions
The following Frequently Asked Questions, answered by the authors of this book, are designed to both measure your understanding of the concepts presented in this chapter and to assist you with real-life implementation of these concepts. To have your questions about this chapter answered by the author, browse to www.syngress.com/solutions and click on the “Ask the Author” form. You will also gain access to thousands of other FAQs at ITFAQnet.com.
|
1.
|
I ran a switch flooding program against my switch and it didn’t do anything, why not?
|

|
|
2.
|
I have hubs daisy-chained through the floors of my company’s building, is that all one collision domain?
|
|
|
3.
|
When I run Ethereal on my Linux system, I don’t see the PROMISC flag in the ifconfig –a output.
|
|
|
4.
|
Will adding encryption to my network decrease performance?
|
|
|
5.
|
What if an attacker compromises a host that I am using a VPN client on?
|
|
|
6.
|
I still don’t understand how one-time passwords work.
|
|
Answers
|
1.
|
Some newer switches are resilient to some of the older flooding tools.
|
|
2.
|
Yes! Hubs do not have any intelligence built into them to know where to send data, so they will blindly forward it on to everyone. So every hub that is connected together is seeing traffic for all ports.
|
|
3.
|
Ethereal uses the libpcap program to perform packet capturing and filtering. Some newer versions if libpcap use a different method of putting an interface into promiscuous mode that ifconfig cannot detect.
|
|
4.
|
Yes, encrypting and decrypting data can be resource–intensive, depending on several factors including the type of encryption algorithm and length of the key. However, depending on your network architecture, end users may not notice the difference in performance.
|
|
5.
|
Your VPN would basically offer a safe and secure environment for the attacker to run wild! For example, you connect your work laptop at home to the Internet over dial-up or high-speed Internet, and your system is compromised via a trojan. Your connections back to the office are secured via a VPN connection which gets enabled once you connect to your mail server or other protected work resources. The attacker then has the ability to access these resources that are otherwise protected by your VPN.
|
|
6.
|
Let me give you an example. You are provided with an RSA Secure ID hardware token. This is a small device that has a screen on it with some numbers that change every sixty seconds. These numbers are your responses to the RSA server challenges, i.e. your password. The token and the server are synchronized, so when you log in, the server presents you with a challenge, i.e. asks you your password, and you type in whatever number is showing on your Secure ID token screen at the time. You will be authenticated for this session, but next time you login it will be a different number, hence a one-time password.
|
Часть 2: Введение в Ethereal: Анализ сетевого протокола
Introduction
You probably picked up this book because you have already heard about Ethereal and its feature-rich graphical user interface (GUI). Maybe you read about it on the Internet, overheard a coworker talking about it, or heard about it at a security conference. However, if you are looking for a comprehensive guide to get you started and unleash the powers of Ethereal, you’ve come to the right place.
Ethereal is undoubtedly the best open source network analyzer available. And, the best part is: it’s free! It is packed with features that are comparable to a commercial network analyzer, and with a large and diverse collection of authors, new enhancements are made everyday. Technically, the code is still considered beta, so there are still bugs. However, once these bugs are reported to the development team, they are quickly resolved. Because Ethereal is actively maintained, new releases tend to come out every few months, but we will be focusing on Ethereal version 0.10.0, since that is the current release at the time of writing this book. Ethereal version 0.10.0 contains many performance enhancements, especially when working with capture files. Several user interface enhancements have also been made, including the application menus, help windows, and capture progress window bar graphs. The source tar files and Linux RPMs have been replaced with version 0.10.0a due to some help file packaging issues.
In this chapter, you’ll get an understanding of what Ethereal is, what its features are, and how to use it on your network architecture for troubleshooting. Additionally, you’ll learn about the history of Ethereal, how it came to be such a popular network analyzer, and why it remains a top pick for administrators.
| Note |
Exactly how is Ethereal pronounced? Well, some people pronounce it with 3 syllables, and two distinct parts, “ether-real”, like real ether, but backwards. Others pronounce it with 4 syllables “e-the-re-al”, as in ghostly or otherworldly. Really, either way is acceptable.
|
What is Ethereal?
Simply put, Ethereal is a network analyzer. It reads packets from the network, decodes them, and presents them in an easy to understand format. We have already mentioned some of the most important aspects of Ethereal: that it is open source, actively maintained, and free. Let’s take a moment to mention some of the other important aspects of Ethereal:
-
It is maintained under the GNU General Public License (GPL).
-
It works in promiscuous and non-promiscuous modes.
-
It can capture data from the network or read from a capture file.
-
It has an easy to read, and very configurable GUI.
-
It has rich display filter capabilities.
-
It supports Tcpdump format capture filters.
-
It has a nice feature that reconstructs a TCP session and displays it in ASCII or Extended Binary Coded Decimal Interchange Code (EBCDIC), hexadecimal dump, or C arrays.
-
It is available in precompiled binaries and source code.
-
It runs on over 20 platforms, both UNIX-based and Windows.
-
It supports over 480 protocols, and because it is open source, new ones are contributed very frequently.
-
It can read capture files from over 20 different products.
-
It can save capture files in a variety of formats including libpcap, Network Associates Sniffer, Microsoft Network Monitor, and Sun snoop.
-
It can capture data from a variety of media including Ethernet, Token-Ring, 802.11 Wireless, and more.
-
It includes a command line version of the network analyzer called tethereal.
-
It includes a variety of supporting programs such as editcap, mergecap, and text2pcap.
-
Output can be saved or printed as plain text or PostScript.
History of Ethereal
Gerald Combs first developed Ethereal in 1997 because he was expanding his knowledge of networking and needed a tool for network troubleshooting. The first version, 0.2.0, was released in July 1998. A development team, including Gilbert Ramirez, Guy Harris, and Richard Sharpe, quickly formed to provide patches, enhancements, and additional dissectors. Dissectors are what allow Ethereal to decode individual protocols and present them in readable format. Since then, a large number of individuals have contributed specific protocol dissectors that they needed and other enhancements to Ethereal. This continues to be a great way to become involved, so if you need support for a particular protocol, start writing a dissector for it! This will not only benefit the project, but yourself and other users as well. You can view the list of authors at www.ethereal.com/introduction._html#authors. Because of the overwhelming development support and the large user base, Ethereal’s capabilities and popularity continue to grow every day.
Compatibility
As we previously stated, Ethereal can read and process capture files from a number of different products including other sniffers, routers, and network utilities. Because Ethereal uses the popular libpcap-based capture format, it interfaces easily with other products that use libpcap. It also has the capability of reading captures in a variety of other formats as well. Ethereal can automatically determine what type of file it is reading and can also uncompress gzip files. The following list shows the products from which Ethereal can read capture files:
-
Tcpdump
-
Sun snoop and atmsnoop
-
Microsoft Network Monitor
-
Network Associates Sniffer (compressed or uncompressed) and Sniffer Pro
-
Shomiti/Finisar Surveyor
-
Novell LANalyzer
-
Cinco Networks’ NetXRay
-
AG Group/WildPackets EtherPeek/TokenPeek/AiroPeek
-
RADCOM’s WAN/LAN analyzer
-
Visual Networks’ Visual UpTime
-
Lucent/Ascend router debug output
-
Toshiba’s ISDN routers dump output
-
Cisco Secure IDS iplog
-
AIX’s iptrace
-
HP-UX nettl
-
ISDN4BSD project’s i4btrace output
-
pppd logs (pppdump-format)
-
VMS’s TCPIPtrace utility
-
DBS Etherwatch VMS utility
-
CoSine L2 debug
-
Accellent’s 5Views LAN agent output
-
Endace Measurement Systems’ ERF capture format
-
Linux Bluez Bluetooth stack “hcidump –w” traces
-
Network Instruments Observer version 9
Supported Protocols
When a network analyzer reads data from the network it needs to know how to interpret what it is seeing and display the output in an easy to read format. This is known as protocol decoding. Often, the number of protocols a sniffer can read and display determines its strength, thus most commercial sniffers can support several hundred protocols. Ethereal is very competitive in this area with its current support of over 480 protocols. New protocols are constantly being added by various contributors to the Ethereal project. Protocol decodes, also known as dissectors, can be added directly into the code or included as plugins. The following list shows the 483 protocols that are currently supported at the time of this writing, no doubt by the time you read this there will be more:
802.11 MGT, AAL1, AAL3_4, AARP, ACAP, ACN, AFP, AFS (RX), AH, AIM, AJP13, ALCAP, ANS, ANSI BSMAP, ANSI DTAP, ANSI IS-637-A Teleservice, ANSI IS-637-A Transport, ANSI IS-683-A (OTA (Mobile)), ANSI MAP, AODV, ARCNET, ARP/RARP, ARTNET, ASAP, ASF, ASN1, ASP, ATM, ATM LANE, ATP, ATSVC, Auto-RP, AVS WLANCAP, BACapp, BACnet, BEEP, BFD Control, BGP, BICC, Boardwalk, BOFL, BOOTP/DHCP, BOOTPARAMS, BOSSVR, BROWSER, BSSAP, BSSGP, BUDB, BUTC, BVLC, CCSDS, CDP, CDS_CLERK, cds_solicit, CFLOW, CGMP, CHDLC, CLDAP, CLEARCASE, CLNP, CLTP, CONV, COPS, COSEVENTCOMM, CoSine, COSNAMING, COTP, CPFI, CPHA, cprpc_server, CUPS, Data, DCCP, DCE_DFS, dce_update, DCERPC, DDP, DDTP, DEC_STP, DFS, DHCPv6, Diameter, DISTCC, DLSw, DNS, DNSSERVER, DOCSIS, DOCSIS BPKM-ATTR, DOCSIS BPKM-REQ, DOCSIS BPKM-RSP, DOCSIS DSA-ACK, DOCSIS DSA-REQ, DOCSIS DSA-RSP, DOCSIS DSC-ACK, DOCSIS DSC-REQ, DOCSIS DSC-RSP, DOCSIS DSD-REQ, DOCSIS DSD-RSP, DOCSIS MAC MGMT, DOCSIS MAP, DOCSIS REG-ACK, DOCSIS REG-REQ, DOCSIS REG-RSP, DOCSIS RNG-REQ, DOCSIS RNG-RSP, DOCSIS TLVs, DOCSIS UCC-REQ, DOCSIS UCC-RSP, DOCSIS UCD, DOCSIS VSIF, DRSUAPI, DSI, DTSPROVIDER, DTSSTIME_REQ, DVMRP, EAP, EAPOL, ECHO, EDONKEY, EIGRP, ENC, ENIP, ENTTEC, EPM, EPM4, ESIS, ESP, ETHERIP, Ethernet, FC, FC ELS, FC FZS, FC-dNS, FC-FCS, FC-SB3, FC-SP, FC-SWILS, FC_CT, FCIP, FCP, FDDI, FIX, FLDB, FR, Frame, FTP, FTP-DATA, FTSERVER, FW-1, GIOP, GMRP, GNUTELLA, GPRS NS, GRE, Gryphon, GSM BSSMAP, GSM DTAP, GSM MAP, GSM RP, GSM SMS, GSS-API, GTP, GVRP, H.261, H.263, H1, H225, H245, H4501, HCLNFSD, HPEXT, HSRP, HTTP, HyperSCSI, IAPP, IB, ICAP, ICL_RPC, ICMP, ICMPv6, ICP, ICQ, IEEE 802.11, IGAP, IGMP, IGRP, ILMI, IMAP, INITSHUTDOWN, IP, IPComp, IPFC, IPMI, IPP, IPv6, IPX, IPX MSG, IPX RIP, IPX SAP, IPX WAN, IRC, ISAKMP, iSCSI, ISDN, ISIS, ISL, iSNS, ISUP, IUA, Jabber, KADM5, KLM, Kpasswd, KRB5, KRB5RPC, L2TP, LACP, LANMAN, LAPB, LAPBETHER, LAPD, Laplink, LDAP, LDP, LLAP, LLC, LMI, LMP, LPD, LSA, LSA_DS, Lucent/Ascend, LWAPP, LWAPP-CNTL, LWAPP-L3, LWRES, M2PA, M2TP, M2UA, M3UA, Malformed packet, MAPI, MDS Header, MEGACO, Messenger, MGCP, MGMT, MIPv6, MMSE, Mobile IP, Modbus/TCP, MOUNT, MPEG1, MPLS, MRDISC, MS Proxy, MSDP, MSNIP, MSNMS, MTP2, MTP3, MTP3MG, MySQL, NBDS, NBIPX, NBNS, NBP, NBSS, NCP, NDMP, NDPS, NetBIOS, NETLOGON, NFS, NFSACL, NFSAUTH, NIS+, NIS+ CB, NLM, NLSP, NMPI, NNTP, NSPI, NTLMSSP, NTP, Null, OAM AAL, OSPF, OXID, PCLI, PCNFSD, PER, PFLOG, PFLOG-OLD, PGM, PIM, POP, Portmap, PPP, PPP BACP, PPP BAP, PPP CBCP, PPP CCP, PPP CDPCP, PPP CHAP, PPP Comp, PPP IPCP, PPP IPV6CP, PPP LCP, PPP MP, PPP MPLSCP, PPP PAP, PPP PPPMux, PPP PPPMuxCP, PPP VJ, PPPoED, PPPoES, PPTP, Prism, Q.2931, Q.931, Q.933, QLLC, QUAKE, QUAKE2, QUAKE3, QUAKEWORLD, RADIUS, RANAP, Raw, Raw_SIP, RDM, REMACT, REP_PROC, RIP, RIPng, Rlogin, RMCP, RMI, RMP, roverride, RPC, RPC_BROWSER, RPC_NETLOGON, RPL, rpriv, RQUOTA, RS_ACCT, RS_ATTR, RS_BIND, rs_misc, RS_PGO, RS_PLCY, rs_prop_acct, RS_REPADM, RS_REPLIST, RS_UNIX, rsec_login, RSH, RSTAT, RSVP, RSYNC, RTCFG, RTCP, RTMP, RTNET, RTP, RTP Event, RTSP, RWALL, RX, SADMIND, SAMR, SAP, SCCP, SCCPMG, SCSI, SCTP, SDLC, SDP, SEBEK, SECIDMAP, Serialization, SES, sFlow, SGI MOUNT, Short frame, SIP, SKINNY, SLARP, SliMP3, SLL, SMB, SMB Mailslot, SMB Pipe, SMPP, SMTP, SMUX, SNA, SNA XID, SNAETH, SNMP, Socks, SONMP, Spnego, SPNEGO-KRB5, SPOOLSS, SPRAY, SPX, SRVLOC, SRVSVC, SSCOP, SSH, SSL, STAT, STAT-CB, STP, STUN, SUA, SVCCTL, Syslog, T38, TACACS, TACACS+, TAPI, TCAP, TCP, TDS, TELNET, TEREDO, TFTP, TIME, TKN4Int, TNS, Token-Ring, TPCP, TPKT, TR MAC, TSP, TZSP, UBIKDISK, UBIKVOTE, UCP, UDP, UDPENCAP, Unreassembled fragmented packet, V.120, Vines ARP, Vines Echo, Vines FRP, Vines ICP, Vines IP, Vines IPC, Vines LLC, Vines RTP, Vines SPP, VLAN, VRRP, VTP, WBXML, WCCP, WCP, WHDLC, WHO, WINREG, WKSSVC, WSP, WTLS, WTP, X.25, X.29, X11, XDMCP, XOT, XYPLEX, YHOO, YMSG, YPBIND, YPPASSWD, YPSERV, YPXFR, ZEBRA, ZIP
Ethereal’s User Interface
Ethereal’s graphical user interface is very configurable and easy to use. We will be covering the interface in detail in Chapter 4, however we want to touch on some of the highlights here. Like other network analyzers, Ethereal displays capture information in three main window panes. Figure 2.1 shows what a typical Ethereal capture looks like in each of its panes. Each of the panes is adjustable in size by clicking on the row of dots between the panes and dragging up or down. The upper-most pane is the summary pane that displays a one–line summary of the capture. Ethereal’s default fields include: packet number, time, source address, destination address, and the name and information about the highest-layer protocol. These columns are configurable and new ones can be added under Preferences. You can also click on the column heading to sort ascending and descending by each field.
| Note |
You will notice that the Windows Ethereal GUI resembles a Unix application rather than a native Windows application. This is because Ethereal uses the GIMP Tool Kit (GTK) library to create the interface. So regardless of the operating system (OS) you are running it on, Ethereal will look the same.
|
The middle pane is the protocol detail view. This pane provides all of the details for each of the layers contained inside the captured packet in a tree-like structure. Clicking on various parts of the protocol tree will highlight corresponding hexadecimal and ASCII output in the bottom pane. The bottom displays the raw captured data both in hexadecimal and ASCII format. Clicking on various parts of this data will also highlight the corresponding fields in the protocol tree in the middle pane. Figure 2.1 shows the Ethereal interface and an example of a network SYN scan. Notice that highlighting the source MAC address in the middle, protocol view pane, automatically highlights that portion of the hexadecimal dump in the bottom data pane.
One of the coolest features of Ethereal is its ability to reassemble all of the packets in a TCP conversation and display the ASCII in a very easy to read format. It can also be viewed in EBCDIC, Hex dump, and C arrays. This data can then be saved or printed. A good use for this can be to reconstruct a web page. Just follow the stream of the HTTP session and save the output to a file. You should then be able to view the reconstructed HTML offline, without graphics of course, in a web browser. Figure 2.2 shows the TCP stream output of a Telnet session. Notice how easy it is to read the username and password in cleartext. Some text, such as “root” and “exit” includes double letters because it is displaying the sending of the character and the ACK response of the character from the server. This is a good example of why you would never want to Telnet as root!
Filters
Filtering packets helps you find what you are looking for without sifting through numerous other distracting packets. Ethereal has the ability to use both capture filters and display filters. The capture filter syntax follows the same syntax that Tcpdump uses from the libpcap library. This is used on the command line or in the Capture Filter dialog box to capture certain types of traffic. Display filters provide a powerful syntax to sort on traffic that is already captured. As the number of protocols grows, the number of protocol fields for display filters grow as well. However, not all protocols that Ethereal currently supports have display filters. Also, some protocols provide display filter field names for some of their fields, but not all of their fields. Hopefully as the product matures and users contribute to the development process this will change. Table 2.1 shows an example of a supported protocol and its display filters:
Table 2.1: IP Display Filters Internet Protocol (IP)
|
Internet Protocol (IP)
|
|
Field
|
Name
|
Type
|
|
ip.addr
|
Source or Destination Address
|
IPv4 address
|
|
ip.checksum
|
Header checksum
|
Unsigned 16-bit integer
|
|
ip.checksum_bad
|
Bad Header checksum
|
Boolean
|
|
ip.dsfield
|
Differentiated Services field
|
Unsigned 8-bit integer
|
|
ip.dsfield.ce
|
ECN-CE
|
Unsigned 8-bit integer
|
|
ip.dsfield.dscp
|
Differentiated Services Codepoint
|
Unsigned 8-bit integer
|
|
ip.dsfield.ect
|
ECN-Capable Transport (ECT)
|
Unsigned 8-bit integer
|
|
ip.dst
|
Destination
|
IPv4 address
|
|
ip.flags
|
Flags
|
Unsigned 8-bit integer
|
|
ip.flags.df
|
Don’t fragment
|
Boolean
|
|
ip.flags.mf
|
More fragments
|
Boolean
|
|
ip.frag_offset
|
Fragment offset
|
Unsigned 16-bit integer
|
|
ip.fragment
|
IPFragment
|
Frame number
|
|
ip.fragment.error
|
Defragmentation error
|
Frame number
|
|
ip.fragment.multipletails
|
Multiple tail fragments found
|
Boolean
|
|
ip.fragment.overlap
|
Fragment overlap
|
Boolean
|
|
ip.fragment.overlap. conflict
|
Conflicting data in fragment overlap
|
Boolean
|
|
ip.fragment. toolongfragment
|
Fragment too long
|
Boolean
|
|
ip.fragments
|
IPFragments
|
No value
|
|
ip.hdr_len
|
Header Length
|
Unsigned 8-bit integer
|
|
ip.id
|
Identification
|
Unsigned 16-bit integer
|
|
ip.len
|
Total Length
|
Unsigned 16-bit integer
|
|
ip.proto
|
Protocol
|
Unsigned 8-bit integer
|
|
ip.reassembled_in
|
Reassembled IP in frame
|
Frame number
|
|
ip.src
|
Source
|
IPv4 address
|
|
ip.tos
|
Type of Service
|
Unsigned 8-bit integer
|
|
ip.tos.cost
|
Cost
|
Boolean
|
|
ip.tos.delay
|
Delay
|
Boolean
|
|
ip.tos.precedence
|
Precedence
|
Unsigned 8-bit integer
|
|
ip.tos.reliability
|
Reliability
|
Boolean
|
|
ip.tos.throughput
|
Throughput
|
Boolean
|
|
ip.ttl
|
Time to live
|
Unsigned 8-bit integer
|
|
ip.version
|
Version
|
Unsigned 8-bit integer
|
Once you have implemented a display filter, all of the packets that meet this requirement are displayed in the packet listing in the summary pane. You can use the filters to compare fields within a protocol against a value, such as ip.src == 192.168.1.1, or to compare fields to fields, such as ip.src == ip.dst, or just to check the existence of specified fields or protocols. Filters are also used by statistical features and to colorize the packets.
Suppose you would like to create a simple filter to search for a certain protocol or field. For example, if you want to see all of the HTTP packets, simply type http. To see just HTTP request packets, such as GET, POST, and HEAD, type http.request. Filter fields can also be compared against values, such as http.request.method==“GET”, to see just the HTTP GET requests. . The comparison operators can be expressed using the following abbreviations or symbols:
Equal: eq, ==
Not equal: ne, !=
Greater than: gt, >
Less Than: lt, <
Greater than or Equal to: ge, >=
Less than or Equal to: le, <=
Display and capture filters are explained in detail in Chapter 5. We just wanted to give you an overview of just how powerful this Ethereal feature is. As you can see, filters offer a great deal of flexibility when troubleshooting network problems or trying to pinpoint issues. Anything that makes the administrator’s job easier is certainly welcomed!
| Note |
Ethereal supports many different types of media, such as Ethernet, Token Ring, Wireless, and asynchronous transfer mode (ATM). You may want to check the “Supported Capture Media” table at www.ethereal.com/media.html to ensure that you are using a compatible OS and media. You will notice that Linux supports just about all media types. You will also notice that Ethernet is supported on all operating systems.
|
Great Resources!
Some of the best resources for Ethereal information and support include the five e-mail distribution lists. You can subscribe by visiting www.ethereal.com/lists and filling out the appropriate form. One thing to note is that the form asks for a password, which is occasionally e-mailed to you in cleartext. You don’t want to pick the same password that you use for other valuable accounts, because anyone sniffing the network traffic can easily see the cleartext password when it is e-mailed! There are some great conversations on these lists, and a lot of good information is revealed about the source code, new developments, installation issues and more.
-
Ethereal-announce includes announcements on new releases, bug fixes, and general issues about Ethereal. Any general Ethereal user should subscribe to this list to remain current on important topics. This list tends to be low-volume with just a few messages per month. To post a message, send an email to ethereal-announce@ethereal.com.
-
Ethereal-users includes general information and help on using Ethereal. Any general Ethereal user should subscribe to this list to share ideas and suggestions. It contains moderate traffic, typically several messages per day. To post a message, send an e-mail to ethereal-users@ethereal.com.
-
Ethereal-dev includes developer related information about Ethereal. This list contains a lot of information about the inner workings of Ethereal and is intended for those who are interested in contributing to the development of Ethereal. Even if you aren’t the programmer type, this list has lots of great information. Be prepared, however, because this list receives a higher volume of traffic with many messages per day. To post a message, send an e-mail to ethereal-dev@ethereal.com.
-
Ethereal-doc includes documentation-related information about Ethereal. It is intended for those who wish to be involved in the documentation development process. This list tends to be low-volume with just a few messages per month. To post a message, send an e-mail to ethereal-doc@ethereal.com.
-
Ethereal-cvs includes developer-related information to monitor changes to the Ethereal source tree. It is useful for developers to know when changes are made, and what the changes are. The CVS repository sends e-mails to this list every time code is committed to the Ethereal CVS repository. It receives a higher volume of traffic with many messages per day. Users do not post directly to this list and replies to messages on this list should be sent to ethereal-dev@ethereal.com.
When subscribing to the mailing lists you can choose to have your e-mail batched in a daily digest. This is great for high volume lists, to cut down on the amount of traffic and messages. However, you won’t get the attachments that may be included with the e-mails. All of the messages from the mailing lists are also archived on the Ethereal website, as well as a few mirror sites. Messages are categorized by month as far back as 1998. When troubleshooting a problem, a great strategy is to perform a search to see if someone else may have the answer already.
Another great source of information is the Ethereal User’s Guide, by Richard Sharpe, located at www.ethereal.com/docs/user-guide. It is a bit outdated, based on version 0.9.7, but it still contains some great information. It is also available in PDF format at www.ethereal.com/distribution/docs/user-guide.pdf, however, this document seems to be based on version 0.8.19. Beware, when you print out the entire document, it is 454 pages! The first 102 pages include a great deal of good information about installing and using Ethereal. The rest of the document is a list of the hundreds of supported protocols and their associated display filter fields.
As always, the Ethereal web page, www.ethereal.com, has a lot of good information as well. The links page www.ethereal.com/links.html, has some great reference websites. This includes information on protocols, RFCs, networking, port spanning, and other tools. The sample captures page, www.ethereal.com/sample, contains packet traces of various network traffic that can be downloaded and viewed with Ethereal for analysis. This is a great way to learn to use Ethereal and its features, as well as learning about various protocols.
Supporting Programs
Most people who are familiar with Ethereal tend to use the Ethereal GUI. However, when Ethereal is installed it also comes with several other very handy supporting programs. The command line version of Ethereal, called tethereal, and three other programs to assist you in manipulating capture files. We won’t go into too much detail here because these programs are covered in Chapter 6. However, we do want to give you an overview of these programs and why they are used.
Tethereal
Tethereal is the command line version of Ethereal. It can be used to capture live packets from the wire or to read saved capture files. By default, tethereal prints the summary line information to the screen. This is the same information contained in the top pane of the Ethereal GUI. The following shows the default tethereal output:
1.199008 192.168.100.132 -> 192.168.100.122 TCP 1320 > telnet [SYN] Seq=1102938967 Ack=0 Win=16384 Len=0
 1.199246 192.168.100.132 -> 192.168.100.122 TCP 1320 > telnet [SYN] Seq=1102938967 Ack=0 Win=16384 Len=0
 1.202244 192.168.100.122 -> 192.168.100.132 TCP telnet > 1320 [SYN, ACK] Seq=3275138168 Ack=1102938968 Win=49640 Len=0
 1.202268 192.168.100.132 -> 192.168.100.122 TCP 1320 > telnet [ACK] Seq=1102938968 Ack=3275138169 Win=17520 Len=0
 1.202349 192.168.100.132 -> 192.168.100.122 TCP 1320 > telnet [ACK] Seq=1102938968 Ack=3275138169 Win=17520 Len=0
The –V option will cause tethereal to print the protocol tree view, like the middle pane in the Ethereal GUI. This will show all of the protocols in the packet and includes the data portion at the end of the list. The following shows the more detailed protocol tree tethereal output:
Frame 5 (74 bytes on wire, 74 bytes captured)
     Arrival Time: Nov  2, 2003 15:22:33.469934000
     Time delta from previous packet: 0.000216000 seconds
     Time relative to first packet: 1.349439000 seconds
     Frame Number: 5
     Packet Length: 74 bytes
     Capture Length: 74 bytes
 Ethernet II, Src: 00:05:5d:ee:7e:53, Dst: 08:00:20:cf:5b:39
     Destination: 08:00:20:cf:5b:39 (SunMicro_cf:5b:39)
     Source: 00:05:5d:ee:7e:53 (D-Link_ee:7e:53)
     Type: IP (0x0800)
 Internet Protocol, Src Addr: 192.168.100.132 (192.168.100.132), Dst Addr: 192.168.100.122 (192.168.100.122)
     Version: 4
     Header length: 20 bytes
     Differentiated Services Field: 0x00 (DSCP 0x00: Default; ECN: 0x00)
         0000 00.. = Differentiated Services Codepoint: Default (0x00)
         .... ..0. = ECN-Capable Transport (ECT): 0
         .... ...0 = ECN-CE: 0
     Total Length: 60
     Identification: 0x160c (5644)
     Flags: 0x00
         .0.. = Don't fragment: Not set
         ..0. = More fragments: Not set
     Fragment offset: 0
     Time to live: 128
     Protocol: ICMP (0x01)
     Header checksum: 0xda65 (correct)
     Source: 192.168.100.132 (192.168.100.132)
     Destination: 192.168.100.122 (192.168.100.122)
 Internet Control Message Protocol
     Type: 8 (Echo (ping) request)
     Code: 0
     Checksum: 0x3c5c (correct)
     Identifier: 0x0500
     Sequence number: 0c:00
     Data (32 bytes)
 0000  61 62 63 64 65 66 67 68 69 6a 6b 6c 6d 6e 6f 70   abcdefghijklmnop
 0010  71 72 73 74 75 76 77 61 62 63 64 65 66 67 68 69   qrstuvwabcdefghi
Finally, the –x command will cause tethereal to print a hexadecimal and ASCII dump of the packet data with either the summary line or protocol tree. The following shows the hexadecimal and ASCII output with the summary line:
  9.463261 192.168.100.122 -> 192.168.100.132 TELNET Telnet Data ...
 0000  00 05 5d ee 7e 53 08 00 20 cf 5b 39 08 00 45 00   ..].~S.. .[9..E.
 0010  00 9a c3 8a 40 00 3c 06 30 84 c0 a8 64 7a c0 a8   ....@.<.0...dz..
 0020  64 84 00 17 05 29 cd 5d 7d 12 4c 1d ea 76 50 18   d....).]}.L..vP.
 0030  c1 e8 47 ca 00 00 4c 61 73 74 20 6c 6f 67 69 6e   ..G...Last login
 0040  3a 20 53 75 6e 20 4e 6f 76 20 20 32 20 31 35 3a   : Sun Nov  2 15:
 0050  34 34 3a 34 35 20 66 72 6f 6d 20 31 39 32 2e 31   44:45 from 192.1
 0060  36 38 2e 31 30 30 2e 31 33 32 0d 0a 53 75 6e 20   68.100.132..Sun
 0070  4d 69 63 72 6f 73 79 73 74 65 6d 73 20 49 6e 63   Microsystems Inc
 0080  2e 20 20 20 53 75 6e 4f 53 20 35 2e 39 20 20 20   .   SunOS 5.9
 0090  20 20 20 20 47 65 6e 65 72 69 63 20 4d 61 79 20       Generic May
 00a0  32 30 30 32 0d 0a 23 20                           2002..#
When using tethereal to output to a file, by default it will output in the libpcap format. Tethereal can read the same capture files from other products that Ethereal can. Tethereal can also use display, also called read, filters and capture filters just like Ethereal. And finally, it can also decode the same protocols that Ethereal can. Basically, it has almost all of the powers of Ethereal, except the ones inherent to the GUI, in an easy to use command line version. Chapter 3 (Installation) will further elaborate on the –x and –v options.
Editcap
Editcap is a program used to remove packets from a file and to translate the format of capture files. It is similar to the Save As feature, but better. Editcap can read all of the same types of files that Ethereal can, and by default writes to libpcap format. Editcap can also write captures to standard and modified versions of libpcap, Sun snoop, Novel LANalyzer, NAI Sniffer, Microsoft Network Monitor, Visual Network traffic capture, Accellent 5Views capture and Network Instruments Observer version 9. It has the ability to specify all or just some of the packets to be translated. The following is an example of using editcap to translate the first five packets from a tethereal libpcap capture file called capture to a Sun snoop output file called capture_snoop:
C:\Program Files\Ethereal>editcap -r -v -F snoop capture capture_snoop 1-5
 File capture is a libpcap (tcpdump, Ethereal, etc.) capture file.
 Add_Selected: 1-5
 Inclusive ... 1, 5
 Record: 1
 Record: 2
 Record: 3
 Record: 4
 Record: 5
Mergecap
Mergecap is used to combine multiple saved capture files into a single output file. Mergecap can read all of the same types of files that Ethereal can, and by default writes to libpcap format. Mergecap can also write the output capture file to standard and modified versions of libpcap, Sun snoop, Novel LANalyzer, NAI Sniffer, Microsoft Network Monitor, Visual Network traffic capture, Accellent 5Views capture, and Network Instruments Observer version 9. By default, the packets from the input files are merged in chronological order based on each packets timestamp. If the –a option is specified, packets will be copied directly from each input file to the output file regardless of timestamp. The following is an example of using mergecap to merge four capture files (capture1, capture2, capture3, and capture4) into a single Sun snoop output file called merge_snoop, it will keep reading packets until the end of the last file is reached:
C:\Program Files\Ethereal>mergecap -v -F snoop -w merge_snoop capture1 capture2 capture3 capture4
 mergecap: capture1 is type libpcap (tcpdump, Ethereal, etc.).
 mergecap: capture2 is type libpcap (tcpdump, Ethereal, etc.).
 mergecap: capture3 is type libpcap (tcpdump, Ethereal, etc.).
 mergecap: capture4 is type libpcap (tcpdump, Ethereal, etc.).
 mergecap: opened 4 of 4 input files
 mergecap: selected frame_type Ethernet (ether)
 Record: 1
 Record: 2
 Record: 3
 Record: 4
 Record: 5
 Record: 6
 Record: 7
 Record: 8
 Record: 9
 Record: 10
 output removed
Text2pcap
Text2pcap reads in ASCII hexadecimal dump captures and writes the data into a libpcap output file. It is capable of reading hexdumps with multiple packets in them, and building a capture file of multiple packets. Text2pcap can also read in hexdumps of application level data only, by inserting dummy Ethernet, IP, and UDP or TCP headers. The user can specify which of these headers to add. This way Ethereal and other sniffers can read the full data. The following is an example of the type of hexadecimal dump that text2pcap can recognize:
0000  00 05 5d ee 7e 53 08 00 20 cf 5b 39 08 00 45 00   ..].~S.. .[9..E.
 0010  00 9a 13 9e 40 00 3c 06 e0 70 c0 a8 64 7a c0 a8   ....@.<..p..dz..
 0020  64 84 00 17 05 49 0e a9 91 43 8e d8 e3 6a 50 18   d....I...C...jP.
 0030  c1 e8 ba 7b 00 00 4c 61 73 74 20 6c 6f 67 69 6e   ...{..Last login
 0040  3a 20 53 75 6e 20 4e 6f 76 20 20 32 20 31 37 3a   : Sun Nov  2 17:
 0050  30 36 3a 35 33 20 66 72 6f 6d 20 31 39 32 2e 31   06:53 from 192.1
 0060  36 38 2e 31 30 30 2e 31 33 32 0d 0a 53 75 6e 20   68.100.132..Sun
 0070  4d 69 63 72 6f 73 79 73 74 65 6d 73 20 49 6e 63   Microsystems Inc
 0080  2e 20 20 20 53 75 6e 4f 53 20 35 2e 39 20 20 20   .   SunOS 5.9
 0090  20 20 20 20 47 65 6e 65 72 69 63 20 4d 61 79 20       Generic May
 00a0  32 30 30 32 0d 0a 23 20                           2002..#
The following is an example of using text2pcap to read the previously shown hexadecimal dump, hex_sample.txt, and output it to the libpcap_output file:
C:\Program Files\Ethereal>text2pcap hex_sample.txt libpcap_output
 Input from: hex_sample.txt
 Output to: libpcap_output
 Wrote packet of 168 bytes at 0
 Read 1 potential packets, wrote 1 packets
Using Ethereal in Your Network Architecture
In the previous chapter we talked about various network hardware devices that can be used to attach a sniffer to the network: cable taps, hubs, and switches. Now we will look at some network architectures and critical points to use Ethereal. Network placement is critical for proper analysis and troubleshooting. Most importantly, you need to make sure that you are on the proper network segment as the devices or problems that you are trying to troubleshoot. When you are troubleshooting network issues you may be moving between various wiring closets, or even different buildings. For this reason it is beneficial to run Ethereal on a laptop. It is also a good idea to keep a small hub and a few network cables, crossover and straight-through, with your laptop for a troubleshooting toolkit. Figure 2.3 shows an incorrect placement of Ethereal if you want to capture communication between the external client and the server. The Ethereal laptop, as well as the switch it is connected to, will never see traffic destined for the server because it will be routed over to the server’s switch.
Figure 2.4 shows how to capture traffic from the external client to the server by using port spanning. The Ethereal laptop has to be connected to the same switch as the server. Next, port spanning has to be activated on the switch to mirror all traffic to and from the server’s port to the port that Ethereal is plugged into. Using this method will not cause any disruption of traffic to and from the server.
Figure 2.5 shows how to capture traffic from the external client to the server by using a hub. You can install a small hub between the server and the switch, and connect the Ethereal laptop to it. Ethereal will then see all traffic going to and from the server. Using this method will temporarily disrupt the traffic to and from the server while the hub is being installed and the cables connected.
Figure 2.6 shows a network architecture that uses a permanent tap installed at the router. Some administrators use this method to have a permanent connection point at critical areas. The Ethereal laptop will then see all traffic going to and from the server, plus any other traffic on this segment. Using this method will not disrupt the traffic to and from the server if the tap is permanent installed and the cables are already connected through it. Taps can also be portable and used like the hub in Figure 2.5.
Most network architectures aren’t as simple as the ones depicted in this section. However, these examples should give you a good idea of how to use Ethereal at various points in your network. Some architectures are very complicated and can be fully meshed and include redundancy, as shown in Figure 2.7. Also, network segments can branch out for several levels as your network is expanded to buildings, and even floors within buildings. You must have a good understanding of your network in order to make the most effective choices for sniffer placement.
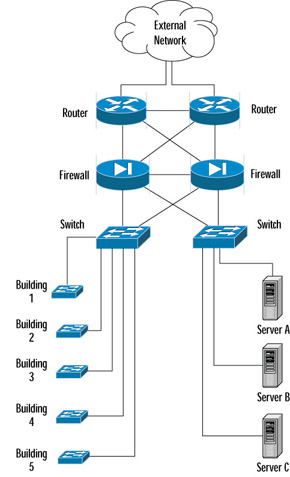 Figure 2.7: Fully Meshed Network
Using Ethereal for Network Troubleshooting
Every network administrator will have the unpleasant occurrence of being paged to solve a network problem. This can often result in a surge of emotions, panic, urgency, and maybe even a sense of heroism. The key to successfully troubleshooting a problem is knowing how your network functions under normal conditions. This will allow you to quickly recognize unusual and abnormal operations. One way to know how your network normally functions is to use your sniffer at various points in the network. This will allow you to get a sense of the protocols that are running on your network, the devices on each segment, and the top talkers (computers that are sending and receiving data most frequently). You may even find some things on your network that you didn’t know about, such as an old printer server that no ones uses any more and is flooding the network with broadcasts.
Once you have an idea of how your network functions, you can develop a strategy for network troubleshooting. This way you can approach the problem methodically and resolve it with minimum disruption to customers. With the basic concept of troubleshooting, a few minutes spent evaluating the symptoms can save hours of time lost because you are tracking down the wrong problem. A good approach to network troubleshooting involves the following 7 steps:
-
Recognize the symptoms
-
Define the problem
-
Analyze the problem
-
Isolate the problem
-
Identify and test the cause of the problem
-
Solve the problem
-
Verify that the problem has been solved
The first step to network troubleshooting is to recognize the symptoms. Besides the annoying beep of your pager, you might also learn about a network problem from another user, network management station alerts, or you may be having trouble accessing the network yourself. The problem could be performance issues, connectivity issues, or other strange behavior. Compare this behavior to normal network operation. Was a change made to the network, or to a server right before the problem started? Did an automatic process, such as a scheduled backup, just begin? Is there a prescheduled maintenance window for this time period? Once you have answered these questions and spoken to the helpdesk or other users, the next step is to write down a clear definition of the problem.
Once the symptoms have been identified and the problem has been defined, the next step is to analyze the problem. You will need to gather data for analysis and narrow down the location of the problem. Is it at the core of the network, a single building, or a remote office? Is the problem related to an entire network segment, or a single computer? Can the problem be duplicated elsewhere on the network? You may need to test various parts of your network to narrow down the problem. You may be using your network analyzer a lot at this step; this is when having it installed on a laptop makes things easier.
Now that you have analyzed and found the problem, you can move onto the next step of isolating the problem. There are many ways you could do this. You may need to disconnect the computer that is causing problems, reboot a server, activate a firewall rule to stop some suspected abnormal traffic, or failover to a backup Internet connection.
The next step to network troubleshooting is to identify and test the cause of the problem. Now that you have a theory about the cause of the problem you will need to test it. Your network analyzer can come in handy here to see what is going on behind the scenes. Sometimes, at this point, you may be researching the problem on the Internet, contacting various hardware or software vendors, or contacting your ISP. You may also want to verify with www.cert.org or www.incidents.org, that this is not some wide spread issue.
Once you have determined a resolution to the problem, you will need to implement it. This could involve upgrading hardware or software, implementing a new firewall rule, reinstalling a compromised system, replacing failed hardware, or redesigning the segments of your network.
The last step to network troubleshooting is to verify that the problem has been resolved. You will also want to make sure that the fix for this problem did not create any new problems, or that the problem you solved is not indicative of a deeper underlying problem. Part of this step of the process includes documenting the steps you took to resolve the problem. This will assist in future troubleshooting efforts. If you find that you have not solved the problem you will need to repeat the process again from the beginning. The flowchart in Figure 2.8 depicts the network troubleshooting process:
| Note |
To be a successful network troubleshooter, you need a strong understanding of network protocols. Understanding different protocols and their characteristics will help you recognize abnormal behavior when it occurs in your network.
|
| Note |
The Ethereal website maintains a spam report at www.ethereal.com/spamreport.html. The spam prevention effort uses a common gateway interface (CGI) application called Sugarplum that generates poisoned HTML pages for anyone that is trying to harvest email addresses from the site. The spam report lists the e-mail address and the IP address of the harvester. You can use this information to match against spam attempts in your mail logs. The website maintainers also list e-mail addresses so that they can’t be automatically harvested, such as “author[AT]ethereal.com”.
|
Summary
We have given you a pretty high-level overview of Ethereal, its various features, and supporting programs. We covered the history of Ethereal, its compatibility with other sniffers, and its supported protocols. We gave you a brief look into the Ethereal GUI and the filter capabilities, because these areas will be covered in detail in later chapters. We also covered the programs that come with Ethereal that add additional functionality by manipulating capture files.
We explored several scenarios for using Ethereal in your network architecture. Spend some time getting to know your network and the way it is connected. Knowing how your network is segmented will greatly help with placing Ethereal to capture the information you need.
Finally, we covered an example network troubleshooting methodology. It is good practice to use this methodology every time you troubleshoot a problem. Once again, spending time getting to know your network, and the protocols running on it will help make troubleshooting a lot easier.
Solutions Fast Track
What is Ethereal?
-
Ethereal is a free and feature rich network analyzer that rivals commercial counterparts.
-
Ethereal can decode more than 480 protocols (See Appendix).
-
Ethereal is compatible with more than 20 other sniffers and capture utilities.
-
Display and capture filters can be used to sort through network traffic.
-
Ethereal mailing lists are a great resource for information and support.
Supporting Programs
-
Ethereal also installs with supporting programs: tethereal, editcap, mergecap, and text2pcap.
-
Tethereal is a command line version of Ethereal.
-
Editcap is used to remove packets from a file and translate the format of capture files.
-
Mergecap is used to merge multiple capture files into one.
-
Text2pcap is used to translate ASCII hexadecimal dump captures into libpcap output files.
Using Ethereal in Your Network Architecture
-
Correct placement of Ethereal in your network architecture is critical to capture the data you need.
-
Taps, hubs, and switches with port spanning enabled, can all be used to connect Ethereal to your network.
-
You should create a troubleshooting toolkit consisting of a small hub, small network tap, and extra straight-through and crossover cables.
-
Installing Ethereal on a laptop makes troubleshooting at various locations easier.
Using Ethereal for Network Troubleshooting
-
Following a methodical troubleshooting process can minimize the time it takes to solve the problem.
-
Identifying and testing the cause of a problem often involves research on the Internet or support calls to hardware or software vendors.
-
Sometimes, solving one problem could create another.
-
Keeping detailed notes on how you solved the problem will assist in future troubleshooting efforts.
Frequently Asked Questions
The following Frequently Asked Questions, answered by the authors of this book, are designed to both measure your understanding of the concepts presented in this chapter and to assist you with real-life implementation of these concepts. To have your questions about this chapter answered by the author, browse to www.syngress.com/solutions and click on the “Ask the Author” form. You will also gain access to thousands of other FAQs at ITFAQnet.com.
|
1.
|
How do I know if someone is already working on a protocol dissector for a protocol that isn’t supported yet by Ethereal?
|
|
|
2.
|
Will port spanning increase the load on my switch?
|
|
|
3.
|
I started using Ethereal on my network just to have a look and I couldn’t believe how much traffic was out there! It was scrolling so fast I couldn’t even make sense of it, what should I do?
|
|
|
4.
|
Do I need to use Editcap to translate capture files that are from different products to a common format before merging them with Mergecap?
|
|
|
5.
|
When I am on call for network problems I follow a basic troubleshooting methodology and keep detailed notes, however my coworkers fail to do the same when they are on call. What should I do?
|
|
|
6.
|
I am using a hub to analyze network traffic, however I am still not seeing all of the traffic.
|
|
|
7.
|
Can I perform port spanning on switches other than Cisco?
|
|
Answers
|
1.
|
Send an e-mail to the Ethereal developers mailing list. Mostly likely if someone is writing a dissector they are also part of this list.
|
|
2.
|
Yes, but how much depends on several factors, such as how many ports you are mirroring, and how much traffic is going through those ports. Newer switches can handle port spanning efficiently and the increased load will not be noticeable.
|
|
3.
|
This is common, especially on larger networks, or networks with large collisions domains. The best thing to do is to start capturing chunks of data and saving them to a file. Then you can use various display filters to sort out the data and make sense of what is going on.
|
|
4.
|
No, Mergecap can automatically translate the files as it merges them. It will do this for all of the compatible products that Ethereal supports. It can even automatically uncompress gzip files if you compiled Ethereal with gzip support.
|
|
5.
|
Get management’s support on the necessity and benefits of documenting the troubleshooting process. You can even suggest that you start a “day after” e-mail report that will thoroughly document the problem and the resolution. This e-mail report can be used to update the upper level management and general users in the organization. Your coworkers would have more reason to comply with this policy when their names will be attached to something so public!
|
|
6.
|
Some hubs have an “auto-sensing” or “dual speed” feature that will sense your network interface card speed and set the hub port to the appropriate speed, 10Mbps, or 100Mbps. Some of these types of hubs will only broadcast 10Mbps traffic to other 10Mbps ports, and 100Mbps traffic to other 100Mbps ports. So if you have mixed speed traffic on your hub you may be missing some if it. Linksys and Netgear have been known to have this issue, check with your hub vendor to see if this is documented for your product.
|
|
7.
|
Yes, port spanning is a Cisco term, but other products perform the same thing and call it port mirroring. These products include HP and Nortel switches, and some newer products are even coming with dedicated management ports built in.
|
|
| hjhjhjh | hjhgjhgjh
2011-08-26 16:54:20 | |
|
|

 LINUX
LINUX 
 Books
Books