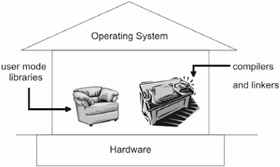
Сервисы
"My problem is that I have been persecuted by an integer."
— George A. Miller
С высоты птичьего полета
Управление памятью-это как дом.
Фундамент-это железо.
Живая часть дома-как операционная система.
Она стоит на фундаменте и зависит от его функциональности.
Дом может быть похож на лачугу,а может быть шикарным особняком.
В каждом доме есть мебель и другие вещи.Иначе бы вы спали на полу и мылись под дождем.
Сервисы-это удобства,которые позволяют пользоваться таким домом с комфортом.
Есть 2 способа,с помощью которого пользовательская программа может выделять память:
память,выделенная на этапе компиляции,и динамически выделяемая память.
Мы рассмотрим оба варианта.
Первая форма обеспечивается средствами разработки.
Все компиляторы работают по-разному.
2-й метод реализуется с помощью библиотечных вызовов типа
malloc () и free ()).
Например,есть несколько реализаций malloc(),которые использует gcc-компилятор.
Мы начнем рассматривать примеры с относительно простых язков типа COBOL,
и потом перейдем на C и Java.
| Note |
Некоторые предпочитают классифицировать выделение памяти по принципу static или dynamic.
Статическая память резервируется программой в момент ее старта и сохраняется до конца ее работы.
Нельзя изменить ее размер.
Динамическая память выделяется во время работы программы.
Ее размер не может быть определен на этапе компиляции,потому что в этот момент он неизвестен.
Динамическая память-это гибкость программы.
Статическая память-это скорость программы.
Комбинация этих двух типов чем-то напоминает стековые конструкции.
|
Выделение памяти на этапе компиляции
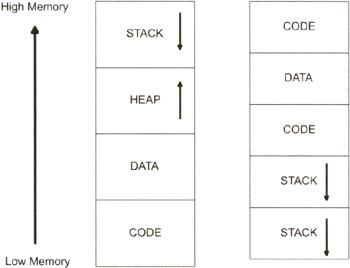
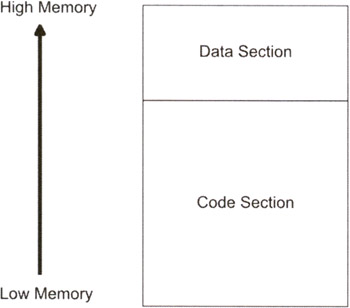
User applications typically have their address space divided into four types of regions:
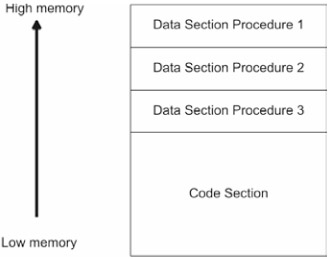
An application may have more than one section of a particular type (see Figure 3.2). For example, an application may have multiple code sections and stacks.
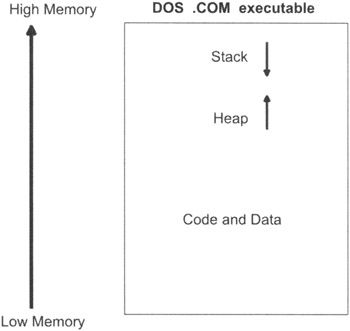
Sometimes an application may have only a single section that is a hybrid of different types (see Figure 3.3). For example, DOS .COM executables, loaded into memory, consist of a single section. Data, as long as it is not executed, can be interspersed with code. The stack pointer register (SP) is set to the end of the executable's image so that the last few bytes serve as an informal stack.
A .COM file has no official boundaries. If the stack overflows into the heap, or if the program is so large that the stack spills into the code, then you are out of luck. Here is a small .COM file program so that you can see what I am talking about:
Here is the build command with MASM: C:\MASM\ SRC> ML /AT smallCom.asm
When you run this application, the following message is printed to the screen:
As you can see, I have placed data, not to mention a whole entire stack, dead in the middle of executable code. There are really very few rules in the case of a .COM binary. Most current executable formats, like the ELF file format or the PE file format, have more strict and established rules with regard to program section arrangement.
| Note |
Regardless of how many or what type of sections a program has, the general rule is that the stack grows down from a high address and the heap grows up from a low address.
|
|
1.
|
What does all of this memory partitioning have to do with development tools?
|

|
Answers
|
1.
|
A compiler is a development tool that acts as a translator. It consumes human-readable source code, moves the source through its compound digestive track, and then emits native machine instructions (or some other type of bytecode). A compiler also determines how the emitted binary values will be organized to provide the four types of memory sections described previously. In general, compilers control how memory is arranged, allocated, accessed, and updated in every section, except the heap. Managing the heap is the domain of user libraries and virtual machines.
|
Сегмент данных
The data section of an application traditionally supplies what is known as static memory. As I mentioned earlier, static memory regions are fixed in size and exist for the duration of an application's life span.
Given these two characteristics, most compilers will construct data sections to serve as storage for global data. For example, consider the following C program:
If we look at a listing file, it is clear that the global variables above have been isolated in their own reserved program section called _DATA. This section will have a fixed size and exist from the time the program starts until the time that it exits.
| Note |
Microsoft has introduced a little bit of confusing nomenclature in the previous assembly code. Microsoft assembly code refers to its application's sections as "segments" (i.e., _TEXT SEGMENT), but it is not the same thing as the memory segments described in the operating system's GDT. I have intentionally called these logical divisions of application memory "sections" to keep you from getting confused. If anything, Microsoft is using the term "segment" as a holdover from DOS, where addresses were specified with a segment and offset address.
|
The data section has a long and venerable history as the second oldest type of application memory section. In the old days, programs were just code and a fixed clump of static storage. The sysop was the only person with a console, punch cards were considered high-tech, and a top-of-the-line Dietzgen-Tyler Multilog slide rule with enamel finish cost $35.
Сегмент кода
At the end of the day, an application's various sections are just bytes in memory. So in some special cases, you can get away with using a code section for data storage. In other words, it is possible to turn a code section into a data section. The magic rule to keep in mind is: It is data as long as you don't execute it. Here is an example:
This can be built as a 16-bit DOS app with Turbo C+ + .
The output you will get will look like this:
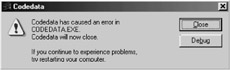
Before you rush out and try to write your own self-modifying app, I think you should know something: In the first chapter, I demonstrated how segments and pages can be marked as read-only, read-write, execute-only, etc. Some operating systems designate the pages belonging to code sections as execute-only, so you cannot always use the previously described trick because the memory in question cannot be read or modified. The above application worked fine running under DOS 6.22 because DOS has absolutely no memory protection.
If you try to run the previous application on Windows via Visual Studio as a Win32 console application, the operating system will stop you in your tracks and present you with a dialog box like the one shown in Figure 3.4.
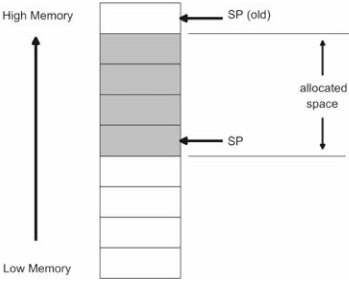
Stack
A stack is a sequence of bytes in memory that act like a first-in-last-out (FILO) data structure. Computer stacks typically "grow down." Each stack has a stack pointer (i.e., SP in Figure 3.5) that stores the lowest address of the last item allocated on the stack. When a new item is added to the stack, the stack pointer is decremented to point to that item's first byte.
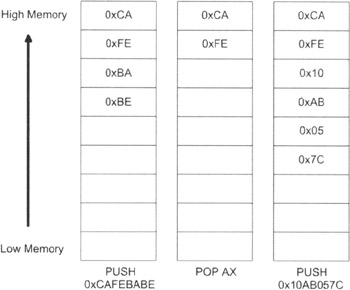
There are two basic ways to manipulate a stack so memory can be allocated and freed: PUSH/POP instructions and integer arithmetic.
Every machine instruction set has a set of PUSH and POP instructions. The PUSH instruction causes the stack pointer to be decremented. The space created by this operation will be populated by the PUSH instruction's operand. The stack pointer will always point to the first byte of the data item on the top of the stack.
The POP instruction causes the stack pointer to be incremented. The storage reclaimed has its data stored in the POP instruction's operand. The PUSH and POP operations are displayed in Figure 3.6 to give you a better idea of how they function.
| Note |
In Figure 3.6, I am assuming that I'm dealing with a native host that is little endian. Little endian architectures store the low-order bytes of a value in lower memory. For example, a value like 0x1A2B3C4D in memory would store 0x4D at byte (n), 0x3C at byte (n + 1), 0x2B at byte (n+2), and 0x1A at byte (n + 3).
A big endian architecture stores the high-order bytes of a value in low memory:
|
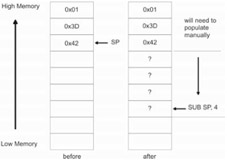
With manual stack pointer manipulation via direct arithmetic, storing and retrieving data is not as automated. Adding or subtracting values from the stack pointer does effectively change where SP points, and this is a very fast way to allocate and free large amounts of storage on the stack. However, transferring data to and from the stack must be done manually. This is illustrated in Figure 3.7.
The stack is a kind of temporary scratch pad that applications can use to keep track of short-lived values. The stack is particularly useful for operations that must be done and then undone. Thus, it is a good way to store and then reclaim temporary data. What distinguishes the stack from a free-for-all storage region, like the heap, is that there are rules that enforce a certain degree of regularity. In other words, the stack is predictable and the heap is chaotic. With the stack, you pretty much always know where the next chunk of memory will start, regardless of how big or small the data item to be allocated is.
The stack, though it might seem simple, is an extremely powerful concept when applied correctly. Stacks are used to implement high-level features like recursion and variable scope. Some garbage collectors use them as an alternative to a heap for more efficient allocation.
Activation Records
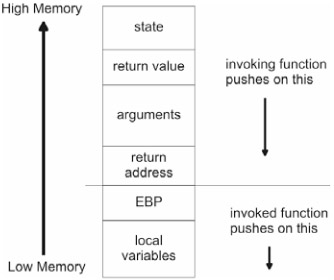
If you wanted to, you could use registers to pass parameter information to a function. However, using registers to pass parameters does not support recursion. Using the stack is a more flexible and powerful technique. Managing the stack to facilitate a function call is the responsibility of both the procedure that is invoking the function and the function being invoked. Both entities must work together in order to pass information back and forth on the stack. I will start with the responsibilities that belong to the invoking function.
The following steps can be used to invoke a procedure and pass it arguments:
-
Push the current function's state onto the stack.
-
Push the return value onto the stack.
-
Push function arguments onto the stack.
-
Push the return address onto the stack.
-
Jump to the location of the procedure.
Using Intel's CALL instruction will typically take care of the last two steps automatically. The function being invoked must also take a few steps to ensure that it can access the parameters passed to it and create local storage:
-
Push EBP on to the stack (to save its value).
-
Copy the current ESP value into EBP.
-
Decrement ESP to allocate local storage.
-
Execute the function's instructions.
The code that performs these four steps is known as the invoked function's prologue.
The result of all this stack manipulation is that we end up with a stack arrangement similar to that displayed in Figure 3.8.
The region of the stack used to store a function's parameters and local storage is referred to as the activation record because every time a procedure is activated (i.e., invoked), this information must be specified. An activation record is also known as a stack frame.
The stack region displayed in Figure 3.8 is an example of an activation record.
| Note |
On Intel machines, the EBP register is pushed on the stack so that it can serve as a reference point. EBP is known as the stack frame pointer, and it is used so that elements in the activation record can be referenced via indirect addressing (i.e., MOV AX, [EBP+5]).
|
| Note |
The arrangement of elements in the activation record does not necessarily have to follow the conventions that I adhere to in this section. Different languages and compilers will use different ordering for items in the activation record.
|
When the function has done its thing and is ready to return, it must perform the following stack maintenance steps:
-
Reclaim local storage.
-
Pop EBP off the stack.
-
Pop the return address off the stack.
-
Jump to the return address.
The Intel RET instruction will usually take care of the last two steps.
The code that performs the previous four steps is known as the invoked function's epilogue.
Once the invoked function has returned, the invoking function will need to take the following steps to get its hands on the return value and clean up the stack:
-
Pop the function arguments off the stack.
-
Pop the return value off the stack.
-
Pop the saved program state off the stack.
Another way to handle the arguments is to simply increment the stack pointer. We really have no use for the function arguments once the invoked function has returned, so this is a cleaner and more efficient way to reclaim the corresponding stack space.
This whole process can be seen in terms of four compound steps:
-
Invoking function sets up stack
-
Function invoked sets up EBP and local storage (prologue) -----called function executes-----
-
Function invoked frees local storage and restores EBP (epilogue)
-
Invoking function extracts return value and cleans up stack
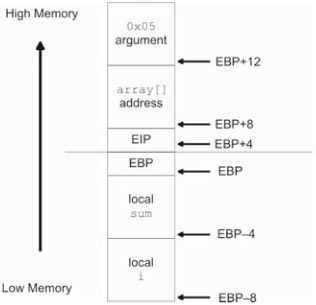
Here is a simple example to illustrate all of the previous points. Consider the following C code:
If we look at a listing file, we can see how activation records are utilized in practice:
OK, let us look at each step as it occurs to understand what the compiler is doing. The first important thing that happens is the call to sigma (). The invoking function, main (), has to set up its portion of the activation record:
The invoking function pushes on the arguments. The CALL instruction automatically pushes a return address onto the stack. What about the return value? As it turns out, the compiler is smart enough to realize that recursion does not exist and uses the EAX register to pass a return value back to main ().
Once execution has reached sigma (), the sigma function sets up the bottom part of the stack frame:
The index variable i requires 4 bytes and the integer variable sum requires 4 bytes. This accounts for the 8 bytes of local storage allocated by the prologue of sigma ().
The activation record produced in this example resembles the one detailed in Figure 3.9.
Once sigma () has calculated its sum, it places the return value in EAX and cleans out the local storage. The RET instruction automatically pops the return address off the stack.
When main () has things back under its control, it cleans up the arguments placed on the stack and extracts the return value from EAX:
You should be able to appreciate the amount of bookkeeping done by the compiler to compute the size of each activation record and the location of each element in them. These calculations are all performed at compile time while the source code is being processed. You should also keep in mind that some compilers have very intelligent optimizers that will take advantage of certain circumstances (for example, by doing sneaky things like using registers to return values).
Scope
The scope of a program element (a variable declaration, a function, etc.) determines both the visibility and, potentially, the life span of the element. When a program element is visible, it can be accessed and manipulated. The life span of a program element determines when the element is created and destroyed.
The one caveat to this rule is for program elements that have their storage space allocated off the heap, dynamically, during execution. In this case, scope only defines the visibility of the program element. The element will exist until it is reclaimed, which may or may not be related to the scope of the element.
To explore the meaning of scope, let us examine how scope rules apply to variables in the C programming language. Scope rules in C are implemented through the use of code blocks. A block of code is a region of source code that lies between a pair of brackets (i.e., between a "{" and a "}").A function definition is an example of a block of code.
In fact, functions are actually at the top of the block hierarchy in C. Functions may contain other blocks of code, as long as the blocks of code are not function definitions (which is to say that function definitions cannot be nested in C). For example, the following function definition contains a few sub-blocks:
From the previous function definition, we can see that blocks of code may be nested. In addition, although blocks of code are usually associated with program control statements, it is possible for blocks of code to exist independently of a program control statement. For example, the code that prints out the value of "j" is a stand-alone block.
Even though functions may contain other blocks of code, blocks of code (that are not function definitions) cannot independently exist outside of a function definition. For example, you would never see:
An ANSI C compiler processing the previous code would protest that the for loop does not belong to a function and would refuse to compile the code.
The scope of variables in C is block based. A variable declared inside of a block of code is known as a local variable. A local variable is visible in the block in which it is declared and all the sub-blocks within that block. A variable cannot be accessed outside of the block in which it was declared. For example, the following snippet of C code is completely legal:
The following snippet of C code, however, is illegal:
In the first case, we are perfectly within the syntactical rules of C when the variable "i" is accessed in a sub-block. In the second case, however, if we try to access the variable "j" outside of its declaring block, the compiler will emit an error. Naturally, there are two special cases to this rule: global variables and the formal parameters of a function.
A global variable is a variable defined outside of any block of code. As such, a global variable is visible throughout a program by every section of code. Global variables also exist for the duration of a program's execution path.
Formal parameters are the variables specified in the prototype of a function. They are the variables that receive the arguments passed to a function when it is invoked. Formal parameters have visibility and a life span that is limited to the body of the function they belong to.
Two basic techniques exist with regard to managing scope within the body of a procedure: the all-at-once approach and additional stack frames.
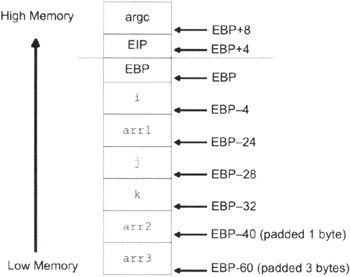
One way to manage scope is to allocate storage for all of a function's local variables in the prologue code. In other words, we use the function's activation record to provide storage for every local variable defined inside of the function, regardless of where it is used. To support this approach, a compiler will use its symbol table to make sure that a local variable is not accessed outside of its declaring block.
Here is an example to help illustrate this:
By looking at its assembly code equivalent, we can see how storage for all these variables was allocated:
The compiler places all of the local variables, even the ones that may not be used, on the procedure's activation record. We end up with an activation record like the one in Figure 3.10. Notice how the compiler pads entries so that they always begin on an address that is a multiple of 4 bytes. This is particularly true for the arr2[] and arr3[] arrays.
The alternative to the all-at-once approach is to give each sub-block its own private activation record. In the "Activation Records" section, we saw how procedure-based scope was implemented. By using the stack, we were able to create storage that had a scope and life span limited to the function. By using this same type of technique on a smaller scale, we can implement visibility and life span on a block-by-block basis.
| Note |
In a way, stacks are really about storage life span. Visibility restrictions follow naturally as a result of life span constraints. Recall that stacks are good for situations in which you need to do, and then undo, an operation. This makes them perfect for creating temporary storage. The limited visibility is more of a side effect of the limited life span. Once a variable has been popped off the stack, it is gone and any reference to it can yield garbage.
|
The easiest way to think of a block of code is like a stripped-down type of function that has no return value and no return address. It only has local variables. Table 3.1 presents a basic comparison of functions and code blocks.
Table 3.1
| |
Saved State
|
Return Value
|
Arguments
|
Return Address
|
Variables
|
|
Function
|
yes
|
yes
|
yes
|
yes
|
yes
|
|
Sub-block
|
yes
|
no
|
yes
|
no
|
yes
|
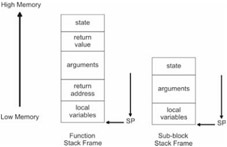
As you can see from the table, a code block has saved program state information and local variables in its stack frame. Local variables declared outside the block but accessed inside the block can be treated as arguments. Figure 3.11 displays a comparison of the stack frames used by a function and a code block.
|
1.
|
|
|
|
2.
|
What are the trade-offs between the all-at-once approach and the additional stack frame approach?
|
|
Answers
|
1.
|
|
|
2.
|
The extra stack frame technique requires that stack manipulation be performed every time a block is entered or exited. If a section of code has a heavily nested set of blocks, this translates into a lot of extra push and pop operations. This means the extra stack frame tactic will create an executable that is larger and slower because more instructions will need to be executed.
Another downside of using the all-at-once tactic is that it requires a lot of storage overhead. Space in the activation record will be reserved even if a variable is not used. If a function has several different possible execution paths, a lot of storage is wasted.
Table 3.2 summarizes a comparison of these two techniques.
Table 3.2
| |
All-at-once Allocation
|
Extra Stack Frames
|
|
Speed
|
faster
|
slower
|
|
Stack memory usage
|
more
|
less
|
|
Executable size
|
smaller
|
larger
|
In the final analysis, real estate on the stack is relatively cheap compared to execution speed, which is why most compilers opt for the all-at-once approach.
|
Static or Dynamic?
The stack is a hybrid between a purely static and a purely dynamic form of storage. It is not purely static because the amount of occupied storage on a stack varies with each function call. Each time a function is invoked, a new activation record is pushed on to the stack. When a function returns, its activation record vanishes and all of its associated data goes out of scope.
However, the way in which stack storage is allocated and freed obeys a strict first-in-last-out (FILO) policy. In addition, the regions of storage consumed on a stack are almost completely dictated by the compiler. In a structured language like C, the stack is populated with nothing but activation records, and the size of each activation record is fixed at compile time. Thus, there is a lot more regularity with a stack than there is with a dynamic storage mechanism like a heap. The stack, as I have said before, is a predictable creature. In addition, because of the presence of a stack pointer, you always know where your next byte will be allocated or released from.
Because of its close connection to the machine instructions emitted by the compiler in terms of prologue and epilogue code, I like to think of the stack as being a memory component whose utilization is tied to the development tools being used. This is why I included a discussion of the stack in this section of the chapter.
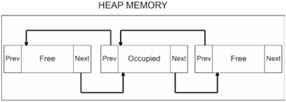
Heap Allocation
Heap memory allocation, also known as dynamic memory allocation (DMA), consists of requesting memory while an application is running from a repository known as the heap. A heap is just a collection of available bytes (i.e., a bunch of bytes piled into a heap). Unlike the data segment or the stack, the size and life span of memory allocated from the heap is completely unpredictable. This requires the agent that manages the heap to be flexible, and this, in turn, translates into a lot of extra memory management code.
The data segment requires no special management code, and stack management is limited primarily to the prologue and epilogue code of functions. The heap, however, normally has its own dedicated set of elaborate routines to service memory requests.
Table 3.3
|
Storage
|
Size
|
Life Span
|
Bookkeeping
|
|
data section
|
fixed
|
program life span
|
none
|
|
stack
|
fixed size stack frames
|
function-based
|
all at compile time
|
|
heap
|
varies
|
varies
|
significant at run time
|
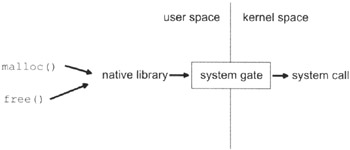
The heap relies heavily on user mode libraries. These libraries (like malloc () and free () declared in stdlib.h) may be invoked directly by programs or called indirectly by a virtual machine. Either way, these libraries normally end up utilizing facilities provided by the underlying operating system. Thus, before we dive straight into managing memory through user libraries, it would help to understand how they communicate with the operating system.
System Call Interface
Most user applications are blissfully unaware of what really goes on to support their execution. They never see the GDT or the page table entries. User applications are strictly memory consumers. Like a pizza-hungry college freshman, applications ask for memory takeout, and the operating system gives it to them; they don't care about the details. User programs have a perspective that is roughly 10,000 feet above the operating system level. At this altitude, the system call interface is all that user-space code sees.
In his book on MINIX, Operating Systems: Design and Implementation, Tanenbaum asserts that the system call interface is what defines an operating system. I would tend to agree with him. The system call interface of an operating system is a set of function prototypes that completely specify every service that the operating system can provide to the outside world. An operating system is nothing more than the implementation of its system calls. If you were a human resources professional, you would view the system call interface as the kernel's formal job description. It dictates the actions that the operating system must be able to perform.
Let us look at a simple example. Take, for instance, the NACHOS operating system. NACHOS was developed by Tom Anderson at Berkeley for instructional use in computer science courses. Its system call interface consists of just 11 routines.
Process Management
File Input/Output
Threads
That is it. Everything that NACHOS is capable of doing is described by the previous 11 functions. Naturally, production grade operating systems have a system call interface that is much larger. Linux, for example, has more than 200 routines defined in its system call interface. You can read descriptions of these 200+ system calls in the Linux man pages (i.e., man2).
| Note |
In case you are wondering, NACHOS stands for Not Another Completely Heuristic Operating System. I think Richard Burgess is correct; we are running out of good acronyms.
|
System calls are not always spelled out with tidy C prototypes. Some operating systems, like DOS, have a system call interface that is specified strictly in terms of interrupts. Consider the following DOS system call:
A wise system engineer will attempt to ward off complexity by banishing the system-related assembly code to the basement of the OS. There, in the darkness, only a trained plumber with a flashlight can muck around with the pipes. Even then, an experienced developer will attempt to wrap the assembly code in C/C++ to make it more palatable. Tanenbaum, for instance, did an excellent job of wrapping assembly routines when he implemented MINIX.
| Note |
I had the opportunity to speak with an engineer who helped manage the construction of the original OS/2 platform. He told me that around 20% of the kernel code was assembler. This is a lot of assembler, especially when you consider that UNIX operating systems, like FreeBSD, have less than 2% of the kernel coded in assembly language. I am sure that the proliferation of assembly code in OS/2 had an impact on the development team's ability to port the code and institute design changes.
|
| Note |
Cloning is not limited to the bio-tech sector. An operating system clone is typically constructed by taking the system call interface of the original OS and performing a clean-room implementation of those calls. The clone differs from the original because those system calls are implemented using different algorithms and data structures. For example, FreeDOS is a clone of Microsoft's DOS. Tanenbaum's MINIX is actually a UNIX clone. It is a well-documented fact that Microsoft's 1982 release of its DOS operating system was a clone of IBM's PC-DOS.
|
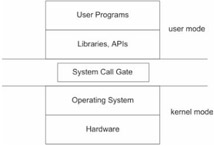
System calls are the atomic building blocks that all other APIs rely on. The user libraries that help to manage memory are built upon the relevant system calls. The layering effect that is generated by building one set of functions on top of another is illustrated in Figure 3.12.
User libraries cannot directly access system calls. They must all travel through a choke point called the system call gate. If an operating system were a fortress, the system call gate would be its drawbridge. Everything outside the gate runs in user mode, and everything inside the fortress runs in kernel mode.
The system call gate is the only way in and out of the kernel. This is because memory management at the operating system level, in conjunction with the processor, prevents user code from making a FAR JMP directly to kernel functions. For the most part, this keeps the Viking pillagers at a safe distance from the inhabitants of the kernel. Occasionally, however, there are curious explorers like Sven Schreiber who find a hole in the castle wall. Sven found a way around the Windows 2000 system call gate. He describes this discovery in his book, Undocumented Windows 2000 Secrets.
| Note |
In an operating system like DOS, which has no memory protection, it is possible to execute an interrupt service routine by using a FAR JMP instruction with some assorted assembly language acrobatics. There's nothing in place to prevent a program from jumping to the location of the system call's instructions and executing them.
|
Typically, a system call gate is implemented as an interrupt handler. The ISR that mans the system call drawbridge checks to see if the user request is valid. If the service request is valid, the call gate ISR then reroutes the request and its arguments to the appropriate system call in kernel space. When the requested system call is done, it hands off execution back to the system call gate, which then returns execution control to the user program.
The C programming language's standard library is a classic example of this tactic. Let's look at a somewhat forced implementation of the putchar () function to see how library functions build upon system functions. To begin with, most standard library implementations define putchar () in terms of its more general sibling, putc (), which writes a character to a given output stream. In the case of putchar (), the output stream is fixed as standard output (stdout).
Thus, to understand putchar (), we must dissect putc ():
The putc() function, in turn, wraps a system call called write (). A recurring theme that you will notice is the tendency of functions with specific duties to invoke more general and primitive routines.
Notice how the write () function is actually a front man for a more general system call gate called SYSTEM_GATE.
The Heap
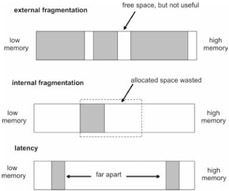
The heap is just a region of bytes. It is a portion of an application's address space that has been set aside for run-time memory requests. As mentioned previously, the general nature of possible memory requests forces the code that manages the heap to have to deal with a number of possible contingencies. The heap manager cannot handle every type of request equally well, and concessions have to be made. As a result of this, heap management is beset by three potential pitfalls:
-
Internal fragmentation
-
External fragmentation
-
Location-based latency
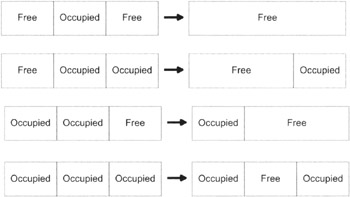
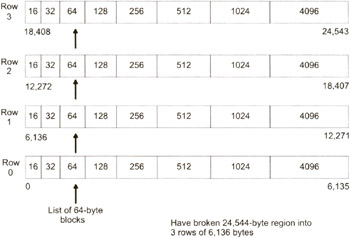
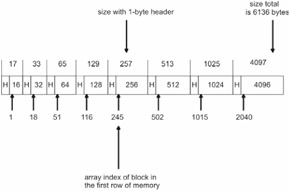
Internal fragmentation occurs when memory is wasted because a request for memory resulted in the allocation of a block of memory that was much too big, relative to the request size. For example, let's say you request 128 bytes of storage and the run-time system gives you a block of 512 bytes. Most of the memory you've been allocated will never be used. Management schemes that allocate fixed-sized memory blocks can run into this problem.
External fragmentation occurs when a series of memory requests leaves several free blocks of available memory, none of which are large enough to service a typical request.
Latency problems can occur if two data values are stored far apart from one another in memory. The farther apart two values are in memory, the longer it takes for the processor to perform operations that involve those values. In an extreme case, one value may be so far away that it gets paged-out to disk and requires a disk I/O operation to bring it back into the ball game.
Latency problems can also occur because of complexity. If an algorithm takes extensive measures to ensure that internal and external fragmentation are both minimized, the improvement in memory utilization will be offset by the additional execution time necessary to perform the requisite accounting.
Depending on the allocation technique used by the heap management code, it will suffer from one or more of these problems. Rarely can you have your cake and eat it too.
Figure 3.13 displays these three pitfalls.
In the end, what makes the heap an interesting problem is not the heap itself, but the algorithms used to manage it. There are two different approaches to managing heap memory: manual memory management and automatic memory management.
In the next two sections, I will examine both of these techniques and offer examples of how they are used in practice.
Manual Memory Management
Manual memory management, also known as explicit memory management, requires the programmer to explicitly allocate and recycle heap storage. This is performed through function calls like malloc() and free(). Explicit memory management shifts responsibility onto the shoulders of the developer with regard to keeping track of allocated memory.
The result of this is that the algorithms implemented by the run-time systems are simpler and involve less bookkeeping. This is both a blessing and a curse. Explicit memory management allows programs to be smaller because the compiler does not have to emit any extra instructions or data to handle garbage collection. In addition, explicit memory management also gives the programmer a better idea of what is actually going on behind the curtain.
The curse of this extra complexity is that it can lead to mistakes (this is an understatement).
If a dynamically allocated variable leaves its scope before being recycled, the memory cannot be recycled and the program will gradually drain away memory until the computer halts. This is known as a memory leak, and is an insidious problem to try to correct (the author is a voice of experience in this matter). In Chapter 2 we encountered a program that created a memory leak during the discussion of siege warfare.
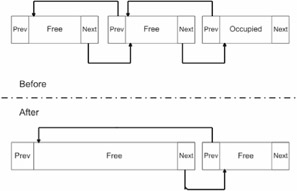
If a dynamically allocated variable is recycled before it goes out of scope, the variable will become an invalid reference and can potentially crash the program (or produce incorrect results, which is even worse). The invalid reference in this kind of situation is known as a dangling pointer.
Memory leaks and dangling pointers are the bugaboos of every C programmer's working hours. Trying to find these problems by inspection alone can entail many frustrating debugging sessions. Fortunately, there are specialized tools that can be used to track down memory leaks. These tools tend to be platform specific, so it is hard to recommend a universal solution. The Boehm-Demers-Weiser (BDW) conservative garbage collector, described later, can be used as a memory leak detector on several platforms.
Example: C Standard Library Calls
The ANSI C standard library, whose prototypes are spelled out in stdlib.h, supports manual memory management through a series of four functions:
The calloc() function allocates an array of num elements, each element being size bytes long, and initializes everything to zero. The free () function releases an allocated block of memory. The malloc() function allocates size number of bytes from the heap. The realloc() function changes the size of an allocated block of memory. As you can see, there are very few amenities. Calls to calloc() and realloc() typically end up indirectly calling malloc(). So most of the behind-the-scenes work is actually done by malloc() and free().
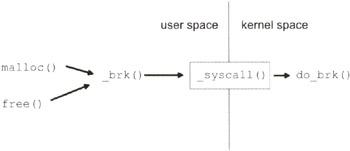
The implementation of malloc () and free () varies greatly from one distribution to the next, so it is a little harder for me to offer reference implementations. The malloc () and free () functions on UNIX platforms are front men for the brk () system call. Its prototype usually resembles something like this:
The brk () system call is responsible for modifying the size of a program's heap by either increasing or decreasing its end point. The end_heap value can be changed as long as it does not infringe on other sections of the application.
| Note |
The POSIX standard does not include brk () on the grounds that it dictates a certain underlying memory model implementation. On most flavors of UNIX, however, you will find the brk () system call. If you are interested in looking at an implementation of brk (), I would recommend taking a look at the one that accompanies Linux. It is located in the /usr/src/linux/mm/mmap.c file.
|
Now that you are familiar with C's manual memory allocation functions, I can demonstrate how dangling pointers occur and what happens when they do. Consider the following example:
This program will produce the following output when it is run:
As expected, the contents of memory pointed to by cptr1 were corrupted after it was prematurely set free. Imagine what would happen with a dangling pointer to a database handle in a large ERP application...
Automatic Memory Management
Automatic memory management, also called garbage collection, takes care of all the memory recycling details. This allows the programmer to focus on domain-specific problem solving. An analyst who is writing a purchase-order system already has enough complexity to deal with just trying to get the logic of the purchase-order application to function. Having to manage low-level details like memory only makes the job more difficult.
| Note |
Scientists like George Miller have claimed that the average human can only keep track of about seven things at any point in time. By forcing the developer to keep track of memory recycling, the number of things the developer has to juggle increases. Garbage collection is an effective solution to this problem.
Don't take my word for it. Here is what Bertrand Meyer, the inventor of Eiffel, has to say:
"Manual memory management — that is to say, the absence of automatic garbage collection — suffers from two fatal flaws: it is dangerous (as it is all too easy to make a mistake, causing errors that are often missed during testing and arise only when the system goes operational, usually in erratic and hard-to-reproduce conditions); and it is extremely tedious, forcing the developer to concentrate on mundane yet complex tasks of bookkeeping and garbage collection instead of working on their application. These deficiencies are bad enough to cancel out any benefit that is claimed for the application of object-oriented techniques."
|
A significant benefit of using a garbage collector is that the recycling problems that plague manual memory management are eliminated. Memory leaks and dangling pointers do not exist in a program that uses automatic memory management. Automatic memory takes care of freeing allocated memory so the programmer isn't given the opportunity to make a recycling error.
Garbage collection was entirely theoretical until 1959, when Dan Edwards implemented the first garbage collection facilities. It just so happened that Dan was involved with John McCarthy in the development of the LISP programming language. LISP, which was intended for algebraic LISt Processing, started off as a notational concept that evolved into a computer language. When compared to other programming languages that existed during its development, LISP was way ahead of its time.
There were, however, problems with LISP's performance, and this was probably the price that LISP paid for its advanced features. The garbage collection schemes in early implementations of LISP were notoriously slow. One response to this problem was to push basic operations down to the hardware level. There were companies that attempted to follow this route, like Symbolics, which sold LISP machines. LISP machines were manufactured in the 1970s and 1980s. The idea, unfortunately, never really caught on. In the mid-1990s, Symbolics went bankrupt.
There are a number of programming environments that support automatic memory management. This includes popular virtual machines like Java's and more obscure run times, like the one that Smalltalk utilizes. There are even garbage collectors than can be plugged into native code via user mode libraries. This brings us to the Boehm-Demers-Weiser conservative garbage collector.
Example: The BDW Conservative Garbage Collector
The Boehm-Demers-Weiser (BDW) conservative garbage collector is a drop-in replacement for malloc() that eliminates the need to call free(). This allows old, moldy C programs to have their memory management scheme upgraded with minimal effort. The only catch is that the BDW collector has to be ported, which is to say that the collector has platform dependencies. If you are working on an obscure platform, like Trusted Xenix, you will not be able to use it.
| Note |
The BDW garbage collector can also be modified to detect memory leaks.
|
You can download a copy of the distribution and view additional information by visiting http://reality.sgi.com/boehm/gc.html.
The BDW distribution has been ported to a number of different platforms. Each one has its own makefile. On Windows, the BDW garbage collector can be built into a single-threaded, static library (gc.lib) using the following command:
| Note |
You will need to make sure that the necessary environmental variables have been set up. You can do so by executing the VCVARS32.BAT batch file before you invoke NMAKE.
|
Here is a short example to demonstrate the BDW collector in action:
In the previous code example, I reuse the bdwptr pointer repeatedly in an effort to create a memory leak. If you compile and run this program on Windows, you will get output like the following:
As you can see, the amount of free memory does not just descend downward, as it normally would if you were using malloc(). Instead, it increases a couple of times, which indicates that garbage collection has occurred. At the end of the sample code, I explicitly force collection to illustrate this.
| Note |
You will need to make sure that the linker includes gc.lib in its list of libraries. Also, I could only get this to work with the release version of Visual Studio's libraries. Trying to link gc.lib to Microsoft's debug libraries gave my linker a fit.
|
Manual Versus Automatic?
I cannot think of a better way to start a heated argument at an engineering meeting than to bring up this topic. Within minutes, people will go from calm and deliberate to emotional and violent. Although I have my own opinion, I am going to back up my conclusions with source code that you can test yourself. Nothing beats empirical evidence.
Both explicit memory management and automatic memory management involve explicit allocation of memory; the difference between the two methods is how they deal with memory that isn't needed anymore and must be discarded back into the heap.
Garbage collection advocates claim that the energy committed to dealing with memory leaks and dangling pointers would be better spent on building a garbage collection mechanism. This is a very powerful argument — if the performance hit from garbage collection bookkeeping is not noticeable.
This is a big "if."
Early garbage collection implementations like the one for LISP were notoriously slow, sometimes accounting for almost 50% of execution time. Not to mention that explicit memory management proponents will argue that the emergence of tools that detect memory leaks have eliminated traditional problems. Thus, performance is a key issue.
Garbage collection supporters will jump up and down in an effort to demonstrate that the performance problems that plagued LISP are no longer an issue. It is as though they are personally insulted that you are questioning their position.
Let's try to avoid arm waving and examine some published results.
I found two articles that take a good look at the Boehm-Demers-Weiser conservative garbage collector. The first, a 1992 paper by Benjamin Zorn, demonstrates that the BDW collector is, on average, about 20% slower than the fastest explicit memory manager in each experimental trial. The second, published by Detlefs et. al. in 1993, indicates that the BDW collector is, on average, about 27% slower than the fastest explicit memory manager in each experimental trial. In these articles, this was what the authors claimed was the "comparable" performance of the BDW garbage collector.
Table 3.4 presents a comparison of manual and automatic memory management.
Table 3.4
| |
Manual Memory Management
|
Automatic Memory Management
|
|
Benefits
|
size (smaller)
speed (faster)
control (you decide when to free)
|
constrains complexity
|
|
Costs
|
complexity
memory leaks
dangling pointers
|
larger total memory footprint "comparable" performance
|
Garbage collection is not a simple task. It requires the garbage collector to ferret out memory regions that were allocated but are no longer needed. The bookkeeping procedures are complicated, and this extra complexity translates into executable code. Hence, the total memory image of a program using garbage collection will be larger than one that uses automatic memory management.
Let us look at an example. This way, I cannot be accused of supporting my conclusions with arm waving. Consider the following program that uses traditional memory management facilities:
Now look at one that uses the BDW collector:
When I built both of these programs on Windows, the executable that used manual memory management calls was 27,648 bytes in size. The executable that used the BDW collector was 76,800 bytes in size. This is over twice the size of the other program. QED.
With manual memory management, the programmer is responsible for keeping track of allocated memory. None of the bookkeeping manifests itself in the source code as extra instructions. When the programmer wants to release memory, they call free(). There is no need to execute a lengthy series of functions to sweep through memory looking for "live" pointers.
In the process of hunting down memory to free, the garbage collector will also find many allocated regions of memory that are still needed, and it will not free these blocks of memory. However, this means that the collector will repeatedly perform unnecessary procedures every time it attempts collection. This suggests to me that these superfluous actions will cause automatic memory collection to be necessarily slower than manual memory management.
Again, I would like to rely on empirical data instead of just appealing to your sense of intuition. Consider the following source code:
Now consider another program that uses the BDW collector:
The program that used malloc () completed execution in 427 milliseconds. The program that used the BDW garbage collector took 627 milliseconds to execute. I ran each of these programs several times to prove to myself that this wasn't some kind of fluke.
-
Manual memory program times: 432, 427, 426, 443, 435, 430, 437, 430
-
BDW collector program times: 633, 622, 624, 650, 615, 613, 630, 627
Time units are in milliseconds. I could have performed more trials and included an extended statistical analysis of mean values, but I think the results are already pretty clear.
| Note |
I ran the previous two programs on a 700MHz Pentium. If you used more recent (GHz) processors, you would still see the same degree of lag.
|
Finally, garbage collection takes control away from the developer. The heap manager decides when to free memory back to the heap continuum, not the developer. For example, Java has a System.gc() call, which can be used to suggest to the Java virtual machine that it free its surplus memory. However, the JVM itself still has the final say as to when memory is actually set free. This can be a good thing for an engineer who doesn't want to be bothered with details, but it is a bad thing if you actually do want to dictate when an allocated block of memory is released.
| Note |
In the end, using explicit or automatic memory management is a religious question, which is to say that deciding to use explicit or automatic methods reflects the fundamental beliefs, values, and priorities of the developer. As I've stated before, there are no perfect solutions. Every approach involves making some sort of concession. Explicit memory management offers speed and control at the expense of complexity. Manual memory management forsakes performance in order to restrain complexity.
|
The Evolution of Languages
The fundamental, core issue encountered in software engineering is complexity. The evolution of programming languages has been driven by the need to manage and constrain complexity. Initially, programs were hard-coded in raw binary. This was back in the days of Howard Aiken's MARK I, which was unveiled in 1944. As the years wore on, programs got to a size where coding in raw binary was simply too tedious.
In 1949, the first assembly language was developed for the UNIVAC I. Assembly language made programming less complicated by replacing raw binary instructions with terse symbolic mnemonics. Originally, a programmer would have had to manually write something like:
Using assembly language, the previous binary instruction could be replaced with:
This primitive symbolic notation helped to make programming easier. Again, programs became larger and more complicated to the extent that something new was needed. This something new reared its head in the next decade. In the 1950s, with the emergence of transistor-based circuits, higher-level languages emerged. Two such languages were COBOL and FORTRAN. All of these early high-level languages were block-based and used the GOTO statement, or something resembling it, to move from block to block.
The emergence of block-based languages led to the development of structured programming in the late 1960s. The essay that led to the birth of structured programming was written by Dijkstra in 1968. It was a letter in the Communications of the ACM titled "GOTO Statement Considered Harmful." This revolutionary paper caused quite a stir. The state-of-the-art languages at the time, like COBOL II and FORTRAN IV, used GOTOs liberally.
| Note |
Structured programming is an approach to writing procedure-based code where the use of the GOTO statement is either minimized or excluded entirely. History sides with Dijkstra. Structured programming was the paradigm that characterized software development in the 1970s and 1980s.
|
When a software team in the 1970s wanted to design a business application, they would first model the data that the application would manage. This usually meant designing database tables and memory resident data structures. This initial collection of schemas and data types would be the starting point around which everything else would revolve. Next, the team would decide on the algorithms and corresponding functions that would operate on the data.
Structured programming is notably either data-oriented or procedure-oriented, but never both.
Even though structured programming was supposed to be a cure-all, it fell short of its expectations. Specifically, the structured approach proved to be inadequate with regard to maintaining large projects. This is a crucial flaw because most of the money invested in a software project is spent on maintenance. During the 1980s, structured programming was gradually replaced by the object-oriented approach that was promoted by languages like C+ + and Smalltalk.
Can you see the trend I'm trying to illuminate?
I am of the opinion that every programming language has a complexity threshold. After a program reaches a certain number of lines of code, it becomes difficult to understand and modify. Naturally, lower-level languages will have a lower complexity threshold than the higher ones. To get an idea of what the complexity threshold is for different types of programming languages, we can take a look at a collection of well-known operating systems (see Table 3.5).
Table 3.5
|
OS
|
Lines of Code
|
Primary Language
|
Source
|
|
DOS
|
20,000
|
assembler
|
Modern Operating Systems (Andrew Tanenbaum)
|
|
MINIX
|
74,000
|
C
|
Operating Systems, Design and Implementation (Andrew Tanenbaum)
|
|
FreeBSD
|
200,000 (kernel only)
|
C
|
The Design and Implementation of 4.4BSD Operating System (McKusick et. al.)
|
|
Windows 98
|
18 million lines (everything)
|
C/C + +
|
February 2, 1999 (A.M. Session) United States vs. Microsoft et. al.
|
From Table 3.5, it seems that the number of lines of code that can be efficiently managed by a language increase by a factor of 10 as you switch to more sophisticated paradigms (see Table 3.6).
Table 3.6
|
Language
|
Paradigm
|
Complexity Threshold
|
|
Raw binary
|
no-holds-barred
|
10,000 instructions
|
|
Assembler
|
block-based using GOTO
|
100,000 lines
|
|
C
|
structured (no GOTO)
|
1,000,000 lines
|
|
C + +
|
object-oriented
|
10,000,000 lines
|
Inevitably, the languages that survive, and perhaps pass on their features to new languages, will be the ones that are the most effective at managing complexity. In the early days of UNIX, almost every bit of system code was written in C. As operating systems have grown, the use of C, as a matter of necessity, has given way to implementation in C+ + . According to an article in the July 29, 1996, Wall Street Journal, the Windows NT operating system consists of 16.5 million lines of code. It is no surprise, then, that Microsoft has begun building some of its primary OS components entirely in C + +. For example, a fundamental component of the Windows NT kernel, the Graphics Device Interface (GDI32.DLL), was written completely in C+ + .
|
1.
|
What does any of this have to do with memory management?
|
|
Answers
|
1.
|
The evolution of programming languages has basically mirrored the development of memory management since the 1950s. As I mentioned earlier, higher-level languages like COBOL and FORTRAN were born around the same time as the transistor. In the beginning, computer memory was entirely visible to a program. There was no segmentation and no protection. In fact, the program typically took up all the available memory. Likewise, the first computer programming languages were also fairly primitive. As time passed, both memory management and programming languages matured into the powerful tools that they are today. There are memory managers today that allow dozens of tightly coupled processors to share the same address space, and there are elegant object-oriented languages that allow complexity to be constrained.
|
In the following sections, I am going to provide a brief survey of several programming languages in order to demonstrate how different languages make use of the different high-level memory services. I will begin with early languages and work my way slowly to the present day. Along the way, I will try to offer examples and insight whenever I have the opportunity.
Case Study: COBOL
COBOL — this one word stirs up all sorts of different reactions in people. COmmon Business Oriented Language was formally defined in 1959 by the Conference On DAta SYstems Language (CODASYL). COBOL has its roots in the FLOW-MATIC language that was developed by Rear Admiral Grace Murray Hopper. Admiral Hopper is considered the mother of modern business computing.
"It's always easier to ask forgiveness than it is to get permission." — Grace Murray Hopper
In 1997, the Gartner Group estimated that there were over 180 billion lines of COBOL code in use and five million new lines of COBOL code being written each year. Authors like Carol Baroudi even estimated the number of lines of legacy COBOL code at 500 billion lines. Needless to say, this mountain of code has taken on a life of its own and probably developed enough inertia to last at least another hundred years.
The preponderance of COBOL is partially due to historical forces. COBOL was adopted by the United States Department of Defense (DoD) in 1960 and became a de facto standard. The reason for this is that the DoD, the largest purchaser of computer hardware both then and now, would not buy hardware for data processing unless the vendor provided a COBOL compiler. Another reason COBOL is so widespread is due to the fact that COBOL is very good at what it is designed for — executing business calculations. When it comes to performing financial computations to fractions of a cent without introducing rounding errors, COBOL is still the king of the hill. The language features that support financial mathematics in COBOL are a very natural part of the language and extremely easy to use.
|
1.
|
Will COBOL ever die? Will it be replaced?
|
|
Answers
|
1.
|
I would like to assume that someday COBOL will be retured. However, I suspect that COBOL houses will probably, fundamentally, stay COBOL houses. 180 billion lines is a lot of source code. They may occasionally renovate with Object COBOL or slap on a new layer of paint with Java, but replacing the plumbing of an aging mansion is a very expensive proposition. In fact, it's often cheaper to just tear the house down and build a new one. Try explaining this to the CFO of a Fortune 100 company. Legacy code may be old, but it supports core business functionality and has been painstakingly debugged. In this kind of situation, legacy code is seen as a corporate asset that represents the investment of hundreds of thousands of man-hours. An architect who actually does want to overhaul a system will, no doubt, face resistance from a CFO whose orientation tends toward dollars and cents. If a system does what it's supposed to and helps to generate income, then why fix it? Throwing everything away for the sake of technology alone is a ridiculously poor excuse.
Another factor that inhibits the replacement of legacy code is the sheer size of an existing code base. In order to replace old code with new code, you have to completely understand the functionality that the old code provides. In a million-line labyrinth of 80-column code, business logic is hard to extract and duplicate. Often, the people who wrote the code have left the company or have been promoted to different divisions. Instituting even relatively simple changes can prove to be expensive and involve months of reverse engineering and testing. I've known Y2K programmers who were too scared to modify legacy code. The old code was so convoluted that they didn't know what kind of repercussions their changes would have.
|
COBOL has been through several revisions. In 1968, the American National Standards Institute (ANSI) released a standard for COBOL. This COBOL standard was revisited in 1974. The current ANSI standard for COBOL, however, is a combination of the ANSI standard that was developed in 1985 coupled with some extensions that were added on in 1989. There have been moves toward a form of object-oriented COBOL and vendors have come out with their own forms of it. Nevertheless, when someone talks about ANSI COBOL, they are referring to COBOL 85 with the additions that were made in 1989. In the following discussion, I will use COBOL 85. I will also compile my code using Fujitsu's COBOL85 V30L10 compiler. If you are running Windows, you can download a copy from Fujitsu's web site.
COBOL is a structured language that does not use a stack or a heap. All that a COBOL program has at its disposal is a single global data section and blocks of instructions. In COBOL parlance, a program consists of four divisions:
-
Identification division
-
Environment division
-
Data division
-
Procedure division
The identification division is used to let the COBOL compiler know the name of the program it is translating. The identification division doesn't get translated in machine code; it is more of a directive. The environment division is used to describe the platform that a program will be built on and run on, as well as to specify the files that it will use. Again, this is mostly metadata that is intended for use by the compiler.
The data division contains, among other things, a working storage section that is basically a large static memory region that serves all of a program's storage needs. As I said before, there is no heap and no stack that a COBOL program can utilize. All that exists is one big chunk of fixed-size, global memory.
The procedure division consists of blocks of instructions. These blocks of code do not have formal parameters or local variables like functions in C. This would require a stack, which COBOL programs do not have. If you want to create storage for a particular block of code, you will need to use some sort of naming convention in the working storage section to help distinguish all the global variables. So the next time someone asks you "what's in a name?", you can tell them.
In general, divisions are composed of sections and sections are composed of paragraphs. Paragraphs are likewise composed of sentences in an effort to make COBOL resemble written English. To this end, COBOL sentences are always terminated with periods.
Division → Section → Paragraph → Sentence.
Here is a simple example so that you can get a feel for how these divisions, sections, and paragraphs are implemented in practice.
The above program prints out:
I have tried to help delineate the different program divisions using comment lines. As you can see, the program consists primarily of data and code. The memory model that this program uses is probably closely akin to the one displayed in Figure 3.14.
| Note |
You might notice line numbers in the previous program's listing. This is a holdover from the days when punch cards were fed to mainframes. The motivation was that if you dropped your box of cards and they became mixed up, you could use the line numbering to sort your cards back to the proper order.
|
| Note |
The arrangement of a COBOL application is closer to that of an assembly language program than it is to any structured language. Data is clumped together in one section, and the code consists of very crude blocks of instructions. Take a look at the following Intel assembly language program, and you will see what I mean. COBOL is, without a doubt, a prehistoric language.
|
This programming approach might not seem so bad. In fact, at first glance, it may appear like an effective way to organize an application. Do not be fooled by such naïve first impressions. With only a single section of working storage to provide read/write memory, a program can become very difficult to read if you want to do anything even remotely complicated.
Consider the following COBOL program that takes a list of values and prints out the average of those values and the maximum value in the list. You should be able to see how COBOL's limitations make simple array manipulation nowhere near as straightforward as it would be in C.
When this source code (statistics. cob) is compiled and linked into an executable, it will produce the following output when run:
The absence of the stack and heap may be a good thing from the view of a sysadmin, who does not have to worry about memory leaks or buffer overflow exploits, but from the perspective of a programmer, COBOL's spartan memory arrangement is a curse. Very large COBOL applications can quickly become impossible to maintain or even understand. As a veteran Y2K COBOL programmer, I can attest to this fact. Some of the programs I looked at were so large, complicated, and crucial to business operations, that I was often scared to touch anything.
Case Study: FORTRAN
FORTRAN has the distinction of being considered one of the first compiled computer languages. The development of FORTRAN began in 1954 and was initiated by a team of engineers at IBM led by John Backus. FORTRAN originally stood for "IBM Mathematical FORmula TRANslation system." Within 10 years, every hardware manufacturer in creation was shipping their computers with a FORTRAN compiler. Naturally, each vendor had to tweak FORTRAN so that they could call their compiler "value added." To help reign in chaos, a standards committee stepped in. In 1966, the first draft of the FORTRAN standard was released by the ASA (a predecessor to ANSI). This version of FORTRAN is known as FORTRAN 66. FORTRAN was the first high-level language to be specified by a standards committee.
| Note |
Any computer science student who has ever studied compiler theory will recognize the name Backus. This is because John Backus helped invent a notation called Backus-Naur Form (BNF), which is used to specify the context-free grammar of a programming language.
|
In 1977, the ANSI committee in charge of FORTRAN released a revised standard. It added several new features to the language including the CHARACTER data type and flow-control constructs like IF-ELSE blocks (i.e., IF... THEN... ELSE... ENDIF). FORTRAN 77 is also known as F77.
In 1990 and 1995, ANSI released new standards for FORTRAN. FORTRAN 90 (F90) was a major revision. FORTRAN 95 (F95) merely added a few extensions. F90, as specified in ANSI X3.198-1992, supplemented F77 with new features like dynamic memory allocation (via ALLOCATE and DEALLOCATE) and a stack to support recursion. However, because of the time lag between the F77 and the F90 standard, other languages were able to win popularity, which pushed FORTAN into the backwaters of history.
For the sake of illustration, I will be looking at FORTRAN 77. F77 occupies the next level of sophistication above COBOL 85 in terms of language features, and this will make it a good stepping-stone.
| Note |
A Control Data veteran once confided in me that, in his day, FORTRAN programmers looked down on COBOL programmers. This was because FORTRAN is geared toward analytic programs that perform sophisticated numerical computation, instead of the mundane dollars-and-cents math that is a core component of COBOL programs. FORTRAN programmers were scientists in white coats, and COBOL programmers were corporate schlubs who sat in cubes.
|
F77, from an organizational standpoint, actually provides much better procedure modularity when compared to COBOL 85. Specifically, an F77 program consists of:
An external procedure can be a function or a subroutine. A function is a procedure that can possess multiple arguments but returns only a single output value via its name identifier. A subroutine is invoked by a CALL statement and can accept an arbitrary number of input and output parameters.
Here is a simple program to help illustrate these concepts:
If you run this program, you will see:
As you can see, F77 provides much better encapsulation than COBOL 85. Each procedure is capable of declaring its own arguments, local variables, and return values. By placing these variables where they are relevant, instead of in a global data section, the code is much easier to read and reuse.
|
1.
|
How does FORTRAN support procedure arguments and local variables without a stack?
|
|
Answers
|
1.
|
In F77, each routine has its own private stash of static memory that serves as a storage space for local variables and arguments. This precludes F77 from implementing recursion, but it does allow an F77 program to utilize a more sophisticated memory model than COBOL 85. An example F77 memory model is displayed in Figure 3.15.
|
One feature that this per-procedure static memory space supports is the SAVE statement. The SAVE statement allows the local variables of a procedure to sustain their values between function calls. If FORTRAN used an activation record for local variables, it wouldn't be possible to implement SAVE.
Here is a short example demonstrating the SAVE statement:
When the previous program is run, the following output is displayed:
Case Study: Pascal
In 1971 Niklaus Wirth presented the world with his specification of a structured language named after a French mathematician who lived during the 17th century. Pascal was inspired heavily by a programming language called ALGOL. This seems only natural when you consider that Wirth was part of the group that originally created ALGOL. During the 1960s, FORTRAN had supplanted ALGOL as the mathematical programming language of choice. As a result, the designers of ALGOL were looking for ways to extend the language.
Pascal supports heavy use of the stack and, unlike F77, allows function calls to be recursive. Pascal also provides manual access to the heap via the NEW and DISPOSE statements. Pascal allows global variables to be defined, which are stored in a static data segment. Pascal is the first language that we have examined that uses the stack, the heap, and a data section.
Wirth admits, however, that Pascal is really a toy language that is intended for educational purposes. The language has a limited set of features, and this handicap is compounded by the fact that the Pascal compiler enforces a rigid set of syntax rules. Pascal is not a suitable language for developing large projects and has been called a bondage-discipline language by some engineers. Wirth ended up moving on to invent other languages like Modula and Oberon. Borland, which marketed a very successful Pascal compiler in the 1980s, currently sells an object-oriented variation of Pascal called Delphi.
| Note |
According to the Hacker's Dictionary, a bondage-discipline programming language is one that forces the programmer to abide by a strict set of syntax rules. The term is used derisively by programmers who feel that a language's syntax rules have their origins in the language designer's world view rather than pragmatic inspiration.
|
A Pascal program lies entirely within the boundaries of its PROGRAM procedure. Inside of the PROGRAM routine are a number of functions that may be arbitrarily nested. This nesting is particularly annoying to a C programmer like me. A FUNCTION is a routine that returns a single value via its identifier, and a PROCEDURE is a function that does not. As with COBOL, procedural code is always prefixed by variable declarations and definitions.
Consider the following program:
When run, this program will generate the following output:
Here is another brief example that demonstrates how Pascal can use different memory components:
If you run this program, the following output will be sent to the console:
The factorial() function is recursive, which proves that Pascal implements activation records on the stack. I also manually allocate an integer off the heap and store its address in the variable iptr^ to show how Pascal's manual memory management scheme works.
Pascal's variety of memory management facilities and its easy-to-read structured format place it above COBOL 85 and F77 on the scale of sophistication. However, Pascal is not a language that you would use to construct production software. The organization of heavily nested routines in Pascal source code does not lend itself to constructing large-scale applications. This is why I decided to present Pascal before my discussion of C and Java. Pascal may possess memory management bells and whistles, but it is not a prime-time language.
Case Study: C
The C programming language is the Swiss army knife of programming languages. It is compact, versatile, and you can do darn near everything with it. Perhaps this is why every operating system being sold today has been written mostly in C. Part of C's utility is based on the language's provision for low-level operations like bit-wise manipulation and inline assembly code. C also possesses a syntax that allows memory addresses to be symbolically manipulated in a number of intricate ways. Furthermore, the fairly simple function-based granularity of scope is a straightforward alternative to Pascal's tendency toward heavy procedure nesting.
| Note |
In a sense, C can be viewed as a nifty macro language for assembly code. C elevates you far enough from assembly code that you don't have to worry about maintaining stack frames or keeping track of offset addresses. You are given enough programming amenities that you don't feel like you are being forced to sleep on the floor. However, C doesn't really take you any higher than a few floors above the basement. You can still hop down and tinker with the rusty old furnace, if you so desire.
|
| Note |
If you are interested in the history of C, I offer a brief synopsis in the "Prerequisites" section of this book's introduction. For those of you who want the short version, a guy at Bell Labs named Ken Thompson wrote an operating system named Unics in assembly code back in the late 1960s. He discovered that porting assembly code is no fun, so he hacked a language called BCPL into a new language that he called B. Soon afterward, two of Ken's friends at Bell Labs (Dennis Ritchie and Brian Kernighan) got mixed up in Ken's project, and C was born. They rewrote Unics in C, Bell Labs trademarked the resulting product as UNIX, and the rest is history.
|
The C language can use all of the high-level memory constructs mentioned in this chapter. C supports global data, local variables, recursion, and dynamic memory allocation. In other words, C can make ample use of data sections, the stack, and the heap. As you saw earlier, there are even tools like the BDW garbage collector, that can be plugged into C as a set of library functions.
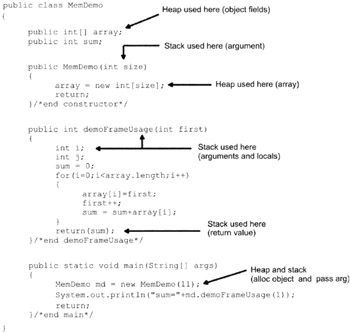
Throughout the chapter, we have used C to illustrate different high-level services. Now we have the opportunity to bring everything together and look at all the services in a single example. Consider the following code:
When this program is executed, the following output will be produced:
The previous code implements a basic error stack. As errors occur, they are popped onto the stack and the stack pointer is incremented. In this example, I run through the full gamut of memory usage. There is global data (i.e., stack [ ]), heap allocation via malloc (), and the stack is used to provide storage for function activation records.
To get a better idea of how this code is realized at the machine level, let's look at an assembly code listing. Don't be concerned if you can't immediately "see" everything that is going on. I will dissect this code shortly and point out the important things. When I am done, you can come back and take a better look. For now, just skim the following assembly code:
 .386P
 .model  FLAT
 PUBLIC  _ErrLvl
 _DATA   SEGMENT
 COMM    _stack:DWORD:040H
 COMM    _SP:DWORD
 _ErrLvl   DD    FLAT:$SG336
     DD    FLAT:$SG337
     DD    FLAT:$SG338
 $SG336    DB    'WARN', 00H
     ORG $+3
 $SG337    DB    'ERROR', 00H
     ORG $+2
 $SG338    DB    'FATAL', 00H
 _DATA   ENDS
 PUBLIC  _bldErr
 PUBLIC  _checkStack
 PUBLIC  _main
 _TEXT   SEGMENT
 _main   PROC NEAR
         push ebp
         mov ebp, esp
         mov DWORD PTR _SP, 0
         call _bldErr
         call _checkStack
         xor  eax, eax
         pop  ebp
         ret  0
 _main   ENDP
 _TEXT   ENDS
 EXTRN   _malloc:NEAR
 EXTRN   _strncpy:NEAR
 _DATA   SEGMENT
     ORG $+2
 $SG344  DB    'testing', 00H
 _DATA   ENDS
 _TEXT   SEGMENT
 _bldErr PROC NEAR
         push  ebp
         mov   ebp, esp
         push  8
         call  _malloc
         add   esp, 4
         mov   ecx, DWORD PTR _SP
         mov   DWORD PTR _stack[ecx*4], eax
         push  128                    ; 00000080H
         call  _malloc
         add   esp, 4
         mov   edx, DWORD PTR _SP
         mov   ecx, DWORD PTR _stack[edx*4]
         mov   DWORD PTR [ecx], eax
         mov   edx, DWORD PTR _SP
         mov   eax, DWORD PTR _stack[edx*4]
         mov   BYTE PTR [eax+4], 1
         push  127                    ; 0000007fH
         push  OFFSET FLAT:$SG344
         mov   ecx, DWORD PTR _SP
         mov   edx, DWORD PTR _stack[ecx*4]
         mov   eax, DWORD PTR [edx]
         push  eax
         call  _strncpy
         add   esp, 12                ; 0000000cH
         mov   ecx, DWORD PTR _SP
         add   ecx, 1
         mov   DWORD PTR _SP, ecx
         pop   ebp
         ret   0
 _bldErr ENDP
 _TEXT   ENDS
 EXTRN   _printf:NEAR
 _DATA   SEGMENT
 $SG350  DB    '%s', 0aH, 00H
 $SG351  DB    '%s', 0aH, 00H
 _DATA   ENDS
 _TEXT   SEGMENT
 _i$ = -4
 _checkStack PROC NEAR
         push  ebp
         mov   ebp, esp
         push  ecx
         mov   DWORD PTR _i$[ebp], 0
         jmp   SHORT $L347
 $L348:
         mov   eax, DWORD PTR _i$[ebp]
         add   eax, 1
         mov   DWORD PTR _i$[ebp], eax
 $L347:
         mov   ecx, DWORD PTR _i$[ebp]
         cmp   ecx, DWORD PTR _SP
         jge   SHORT $L349
         mov   edx, DWORD PTR _i$[ebp]
         mov   eax, DWORD PTR _stack[edx*4]
         mov   ecx, DWORD PTR [eax]
         push  ecx
         push  OFFSET FLAT:$SG350
         call  _printf
         add   esp, 8
         mov   edx, DWORD PTR _i$[ebp]
         mov   eax, DWORD PTR _stack[edx*4]
         xor   ecx, ecx
         mov   cl, BYTE PTR [eax+4]
         mov   edx, DWORD PTR _ErrLvl[ecx*4]
         push  edx
         push  OFFSET FLAT:$SG351
         call  _printf
         add   esp, 8
         jmp   SHORT $L348
 $L349:
         mov   esp, ebp
         pop   ebp
         ret   0
 _checkStack ENDP
 _TEXT   ENDS
 END
If you look for the global variables (i.e., stack [ ], SP, ErrLvl), you will notice that the compiler places them in data sections. However, one thing you might not be aware of is that the compiler also places other various in-code constants (like the string constant "testing") in data sections. This prevents any sort of data from being embedded in a code section. There are good reasons for this. For instance, on Windows, code sections are execute-only, so there is no way that data could be accessed if it were mixed in with the code. The assembler will merge these three different data sections into a single, global _DATA section when the application is built.
If you look at the assembly code for any of the functions, you will notice that they all have prologue and epilogue code to manage activation records. This is irrefutable evidence that the stack is being used. For example, take a look at the assembly code for checkStack():
Finally, the heap allocation that occurs is facilitated by the malloc () library call, which is prototyped in stdlib.h. This may resolve to a system call behind the scenes, such that:
becomes:
Before the actual library call is made, the number of bytes to be allocated is pushed onto the stack. Once the call is over, the address of the first byte of the allocated memory region is placed in EAX.
C has supported all of its memory features since its inception. Stack frames and heap allocation were not extensions amended to the language by a standards committee 10 years after the first specification was released. Instead, C was the product of a few inspired individuals who truly understood the utility of terse and simple language syntax. Compare the grammar of C to that of a committee-based language like COBOL. In contrast to C, COBOL is a behemoth.
But, as Stan Lee would say, "With great power, comes great responsibility." C's flexibility does not come without a price. The very features that allow C to manage memory so effectively can also produce disastrous consequences if they are not used correctly. Memory leaks and dangling pointers are just two of the perils that we have seen. The syntax of C also allows addresses to be cast and moved around so that you might not be sure what a program is referencing.
Here is an example of what I am talking about:
When this program is executed, the following output is generated:
When it comes to pointers of type void, you often cannot tell what is being referenced. The first call (i.e., function1()) returns the address of an integer. The second call (i.e., function2()) returns the address of a function. The third call (i.e., function3()) returns the address of a string. Without looking at the function implementations themselves, you would have no idea what kind of value you are dealing with.
C's simple, function-based organization can also lead to problems. For instance, if the code base you are working with grows beyond a million lines, it can become difficult to control. The tendency to abuse the global nature of C functions can very quickly transform a large project into a morass of tightly interwoven execution paths. You might be confronted with a scenario where one function calls another function that is a distant portion of the source code tree, and this function calls a function that belongs to another distant branch of the source tree. Without C being able to enforce encapsulation, which it can't, everyone can call everyone else. The resulting spaghetti code is difficult to maintain and almost impossible to modify.
Case Study: Java
The Java programming language originally started off as a skunk works project at Sun Microsystems in the early 1990s. Scott McNealy, the CEO of Sun, told James Gosling to go off somewhere and create something brilliant. In May of 1995, Sun released the Java SDK to the public. I can remember downloading my first copy of the SDK in December of 1995. It had an install program that executed from a DOS console, and the virtual machine ran on Windows 95. Heck, the first SDK didn't even touch the Windows registry when it installed (this is a feature I kind of miss).
| Note |
Releasing a new development environment to the public wasn't exactly what Gosling had originally intended. According to Patrick Naughton, one of the original Java engineers, Gosling initially developed the Java virtual machine (JVM) to support a programming language called Oak that was geared toward building embedded programs for consumer appliances. Thus, Java was somewhat of a serendipitous creation.
|
Language Features
Java is an object-oriented (00) language. Specifically, it is a fairly puritanical 00 language. With the exception of atomic data types, like char or int, everything is instantiated as an object. In addition, there are no stand-alone functions in Java; every function must belong to a class. Like other 00 languages, Java supports certain kinds of object encapsulation, polymorphism, and inheritance. However, the Java compiler (javac) also enforces a number of conventions that make it much easier to manage large projects.
Having worked at an ERP company that maintained a code base consisting of 16 million lines of K&R C, I dread the prospect of hunting down header files and obscure libraries, which were invariably spread across a massive, cryptic, and completely undocumented source tree. In the past, sometimes I would spend several hours just trying to find one source file or function definition. There were times where I would start grep at the root of a machine's file system and go have lunch. In fact, I distinctly remember spending an entire afternoon trying to locate the following macro:
In case you're wondering, this ridiculous macro stands for Process Binary Instruction Node Number. Java eliminated this problem in one fell swoop by enforcing a one-to-one mapping between package names and directory names. When I discovered that Java enforced this convention, I felt like jumping and shouting "Amen!"
Some engineers may decry the package directory naming scheme, claiming that it is a characteristic of a bondage-discipline language. These engineers have obviously never worked on a large project. On a large project, you need to maintain organization, even if it is instituted at the cost of flexibility. Sometimes, the only thing between a million lines of code and absolute chaos is a set of well-enforced conventions.
In the past, it has been up to the software engineers involved on a project to be good citizens and obey the informal organizational schemes. However, there was usually nothing stopping a programmer from breaking the rules and introducing complexity into the system. Sure enough, there's always at least one guy who has to do things "his way." As part of the language's masterful design, the founding fathers at JavaSoft decided that the Java run time would take an active role in maintaining an organized source tree by enforcing the package directory naming scheme.
Another design decision that the founding fathers made was to eliminate explicit pointer manipulation. This was another wise decision. As you saw from the example in the last section, pointers are easy to abuse. A sufficient dose of pointer arithmetic can make source code both ambiguous and platform dependent. By allowing only implicit references to objects, Java is able to safeguard programs from all sorts of pointer tomfoolery.
Finally, I think that Gosling had C+ + in mind when he decided that Java would not support multiple inheritance and operator overloading. As far as complexity is concerned, these two features tend to make matters worse instead of making them better. There is nothing scarier than looking at the twisting cyclic relationships that multiple inheritance can generate. It is almost as ugly as spaghetti code. The developer is forced to compensate by using awkward mechanisms like virtual base classes and resolution operators. Likewise, operator overloading tends to make source code more difficult to interpret and understand. If you see a "+", you cannot always be sure if the engineer who wrote the code is talking about integer addition or some "special" operation that might not have anything to do with arithmetic.
| Note |
Java can almost be characterized in terms of what features it does not have, as opposed to the features it does have. By constraining the language's features and instituting a set of additional conventions, the architects of Java were attempting to force a certain level of organization. Having worked with both C++ and Java, I think that Gosling and his coworkers succeeded in doing this.
|
I have often listened to debates concerning the relative merits of C++ and Java. As far as I am concerned, these two languages are different tools used for different jobs. It is like asking, "Which is better, a hammer or a screwdriver?" Both Java and C++ are OO languages, but the primary distinction between them lies in their orientation. Java, first and foremost, is an application language. C++ works better as a system language. Java programs are compiled to run on a virtual machine. "Write once, run anywhere" is a fundamental benefit of implementing a project with Java. The downside to this is that you cannot directly interact with native hardware. By striving for portability, Java has isolated itself from hardware. Building system software requires that you have the ability to insert inline assembly code, explicitly manipulate memory, and generate a native executable. It just so happens that C++ provides these features. Table 3.7 summarizes the differences between C++ and Java.
Table 3.7
|
Language
|
Domain
|
Hardware
|
Motivation
|
Binary Format
|
|
Java
|
application
|
insulate from via virtual machine
|
portability abstraction
|
bytecode
|
|
C + +
|
system software
|
intimate access to native CPU
|
control flexibility
|
native format
|
Virtual Machine Architecture
Java applications are compiled to run on a virtual machine. The Java virtual machine (JVM) provides high-level memory services to Java applications. Thus, to understand how Java applications use memory, we must first understand the operation of the virtual machine.
In terms of the virtual machine's artificial environment, the memory components that the virtual machine provides for Java applications can be divided into two categories: system-wide resources and thread-specific resources (see Figure 3.16).
A Java application consists of one or more executing threads. System-wide resources can be accessed by all of an application's thread. The primary system-wide memory components are the JVM's heap and the method area.
The heap is a large chunk of memory that is used to supply storage for object instantiation. Every time that a new object is created, space on the heap is allocated. The heap is supposed to be supervised by an automatic memory manager. Unfortunately, the JVM specification does not go any further than this. The engineer constructing a JVM has to decide which garbage collection algorithm to use and how to implement that algorithm.
The method area is a mixture between a code section and a static data section. Each class stores the bytecode instructions to its methods in this area. In addition, each class stows its run-time constant pool and field/method metadata in the method area. A constant pool stores, among other things, compile-time literals and indices used to reference other methods/fields.
Each thread has a program counter (PC), its own virtual machine stack. A thread may also possess zero or more native machine stacks to handle native method execution. The program counter is very much like Intel's EIP register. It points to the index of the bytecode instruction being executed by the thread. If native code is being executed instead of bytecode, the program counter's value is undefined.
Each thread has its own stack to provide support for activation records. The JVM spec refers to activation records as frames, as in stack frames. As usual, frames are utilized to provide storage for function arguments, local variables, and return values.
Java Memory Management
A Java application uses the heap and its own private stack for dynamic memory needs. Specifically, an object's field values are stored in its memory region located in the heap. An object's method implementations are stored in the method area. An object's local storage is provided by its private stack frame. Any other static data is placed in a constant pool of the object's corresponding class in the method area. Table 3.8 provides a summary of how Java applications use the different high-level services provided by the virtual machine.
Table 3.8
|
Object Element
|
Storage Space
|
|
fields
|
system-wide heap
|
|
methods
|
system-wide method area
|
|
local variables
|
thread stack
|
|
arguments
|
thread stack
|
|
return value
|
thread stack
|
|
return address
|
thread stack
|
|
static data (i.e., literals)
|
system-wide method area, constant pool
|
Objects are really just the sum of their field values. Two different objects of the same type can share the same method area because it is their field values that distinguish them. To give you a feel for this, the following code shows how you could implement this type of setup in C:
If this program is executed, the following output will be produced:
The objects in this case are collections of fields (i.e., structures). They both use the same member functions (i.e., constructor (), setValues (), toString ()), but they are different because their fields are different.
The best way to see how a Java application uses memory services in practice is to take a small Java program, disassemble it, and examine its bytecode entrails. Consider the following Java program that consists of a single thread of execution. Both the heap and stack are utilized.
When this application is executed, the following output is produced:
| Note |
Do not forget to include the current working directory in your CLASSPATH environmental variable when you run the previous code.
|
Now I will look at each method of MemDemo.java in chronological order and analyze the corresponding bytecode instructions. To generate the necessary bytecode, I used the javap tool that ships with the Java 2 SDK. You will need to pass javap the name of the class file without an extension. The following command line disassembles MemDemo.class:
Instruction opcodes that are prefixed by a hash sign (i.e., "#") represent indices into the run-time constant pool. The item that the index references is placed in brackets to the right of the instruction (i.e., <Method Memdemo (int) >). I will also sprinkle the assembler with single- and double-line comments to help explain what is going on.
Execution begins in the main() method:
The first function that is invoked from main() is the constructor for MemDemo(). Let's take a look at its Java code and the associated bytecode assembler. All of the push instructions are nothing but setup work for the non-push instructions.
After MemDemo() has returned, the demoFrameUsage() method is invoked next. Let's take a look at its Java code and the associated bytecode assembler. As before, most of the push instructions are setups for other instructions.
To summarize what has happened, we started in main(), where an object of type MemDemo is allocated off the heap. The thread's stack is used to pass the integer argument (11) to the constructor of MemDemo. Within the constructor, the heap is used again to allocate an integer array. The call to demoFrameUsage() makes ample use of the stack to support an argument, local variables, and a return value. The value returned by demoFrameUsage () and a string literal reference are used to supply a string argument to System.out.println() using the stack. (See Figure 3.17.)
| Note |
If you are interested in the specifics of a certain bytecode instruction, you should take a look at the JVM specification. It is distributed by Sun Microsystems as an aid to help third parties construct a clean-room implementation of the JVM. The JVM specification is the final word as to the functionality that a JVM has to provide.
|
Memory Management: The Three-layer Cake
You have just spanned the spectrum of memory services that a computer provides. The previous chapters have been relatively dense, and it would be easy to let the details overwhelm you. To help illuminate the big picture, I am going to dedicate this section to pulling everything together.
Memory management occurs at three levels. In the basement lies the processor. The processor provides a set of system registers (i.e., GDTR) and dedicated instructions (i.e., LGDTR) that support the construction of memory management data structures. These data structures include descriptor tables, page directories, and page tables. The processor cannot actually create these data structures; instead, it merely supports their creation and use.
Upstairs, on the street level, is the operating system. The operating system is responsible for taking the raw materials provided by the hardware and constructing an actual memory management implementation. The operating system has to decide which processor features to use and to what extent. For example, both segmentation and paging can be used to institute memory protection. The Intel Pentium supports four levels of privilege for memory segments via the DPL field in descriptor table entries and two levels of privilege for paging via the Supervisor/User flag in page table entries. All three of the protected mode operating systems that we looked at in Chapter 2 used paging as the primary mechanism to implement privilege and access protocols.
Several floors up, sunning themselves on the balcony of a penthouse suite, are the user applications. User applications have it easy. They are insulated from the ugly details of memory management that occur down in the boiler room. When a user application needs memory, it sends a request to the operating system through a third party known as the system call interface. Why leave the penthouse for dinner when you can have the butler pick it up?
User applications view their own address space in terms of a set of memory regions. Most applications can see a stack, heap, data section, and code section. The extent to which they use these regions is determined both by the development tools being used and the run-time libraries that the applications invoke. As we saw in this chapter, older languages tend to possess very primitive memory models. Languages like COBOL 85 and F77 really only use a code section and a static data section. Contemporary languages, like Java, have very sophisticated memory models that make heavy use of the heap and stacks.
The "three-layer cake" of memory management is displayed in Figure 3.18.
References
ANSI, X3.23-1985 (R1991), Programming Languages — COBOL.
This is the COBOL 85 ANSI standard; when someone talks about ANSI COBOL, they are referring to this standard and the 1989 amendments.
ANSI, X3.23b-1993 (R1998), amendment to ANSI X3.23-1985, updated with ANSI X3.23a-1989.
ANSI/ISO/IEC 1539-1:1997, Programming languages — Fortran —
Part 1: Base language. This is the most recent FORTRAN specification.
ANSI, ISO/IEC 9899:1999, Programming languages — C. This is the most recent C specification.
Baroudi, Carol. Mastering Cobol. 1999, Sybex, ISBN: 078212321X. According to Carol, there are 500 billion lines of COBOL code in existence. Unfortunately, she does not reference her sources (bad move). I believe that the Gartner Group's figure of 180 billion has more credibility.
Cooper, Doug. Oh! Pascal. 1993, W.W. Norton & Company, ISBN: 0393963985.
Diwan, A.,D. Tarditi, and E. Moss. Memory Subsystem Performance of Programs with Intensive Heap Allocation. 1993, Carnegie Mellon University, Technical Report CMU-CS-93-227.
Graham, Paul. ANSI Common LISP. 1995, Prentice Hall, ISBN: 0133708756.
Joy, B. (Ed.), G. Steele, and J. Gosling. The Java Language Specification. 2000 Addison-Wesley, ISBN: 0201310082.
Lindholm, T. and F. Yellin. The Java Virtual Machine Specification. 1999, Addison-Wesley; ISBN: 0201432943. For a specification, and I have waded through many, this one is not too difficult to digest. Still, you might want to have Meyer and Downing's book sitting next to you.
Meyer, J. and T. Downing. Java Virtual Machine. 1997, O'Reilly & Associates, ISBN: 1565921941. This is an excellent companion to the actual JVM specification.
Microsoft. Programmer's Guide, Microsoft MASM. 1992, Microsoft Corp., Document No. DB35747-1292. This is not a book for beginners, primarily due to the way that it is organized and presented. However, it is still a good reference if you know what you are looking for. The one complaint that I have about this book is that it invests little or no effort in explaining protected mode assembler. Most of the book is devoted to real mode topics. Considering that almost every application currently being written on Windows is a 32-bit protected mode application, I find this horribly negligent.
Naughton, Patrick. The Java Handbook. 1996, McGraw-Hill Professional Publishing, ISBN: 0078821991. The last section of this book includes an engrossing personal recount of Java's creation by one of the principal engineers.
Ritchie, Dennis M. The Evolution of the Unix Time-sharing System. AT&T Bell Laboratories Technical Journal 63 No. 6 Part 2, October 1984, pp. 1577–93.
Ritchie, Dennis M. The Development of the C Language. 1993, Association for Computing Machinery.
Tanenbaum, A. and A. Woodhull. Operating Systems: Design and Implementation. 1997, Prentice Hall, ISBN: 0136386776.
Zorn, Benjamin. The Measured Cost of Conservative Garbage Collection. 1992, University of Colorado at Boulder, Technical Report, CU-CS-573-92. This is the original paper that touts the BDW garbage collector as having "comparable" performance relative to malloc() and free(). You can crank through the numbers yourself to see what "comparable" means.
Chapter 4: Manual Memory Management
Managing memory in the heap is defined by the requirement that services be provided to allocate and deallocate arbitrary size blocks of memory in an arbitrary order. In other words, the heap is a free-for-all zone, and the heap manager has to be flexible enough to deal with a number of possible requests. There are two ways to manage the heap: manual and automatic memory management. In this chapter, I will take an in-depth look at manual memory management and how it is implemented in practice.
Replacements for malloc() and free()
Manual memory management dictates that the engineer writing a program must keep track of the memory allocated. This forces all of the bookkeeping to be performed when the program is being designed instead of while the program is running. This can benefit execution speed because the related bookkeeping instructions are not placed in the application itself. However, if a programmer makes an accounting error, they could be faced with a memory leak or a dangling pointer. Nevertheless, properly implemented manual memory management is lighter and faster than the alternatives. I provided evidence of this in the previous chapter.
In ANSI C, manual memory management is provided by the malloc() and free() standard library calls. There are two other standard library functions (calloc() and realloc()), but as we saw in Chapter 3, they resolve to calls to malloc() and free().
I thought that the best way to illustrate how manual memory management facilities are constructed would be to offer several different implementations of malloc() and free(). To use these alternative implementations, all you will need to do is include the appropriate source file and then call newMalloc() and newFree() instead of malloc() and free(). For example:
The remainder of this chapter will be devoted to describing three different approaches. In each case, I will present the requisite background theory, offer a concrete implementation, provide a test driver, and look at associated trade-offs. Along the way, I will also discuss performance measuring techniques and issues related to program simulation.
System Call Interface and Porting Issues
The C standard library malloc() and free() functions are procedures that execute in user mode. Inevitably, they rely on native library routines to do the actual dirty work of allocating and releasing memory. The native libraries, in turn, make use of the system call gate to access system calls that reside in kernel mode. This dance step is displayed in Figure 4.1.
The specific native library functions that malloc() and free() invoke will differ from one operating system to the next. On UNIX platforms, malloc() and free() end up invoking the brk() system call through its native library wrapper function, sbrk(). Figure 4.2 shows an example of how this works in MINIX.
Because I am developing on Windows, instead of sbrk() I will be using the Win32 HeapXXX() functions to act as my touch point to the kernel. Here are the specific Win32 routines that I will be invoking:
Here is a short example to give you a feel for how these functions are utilized. In the following example, I allocate a 2MB heap and populate it with the letter "a." Then I increase the size of the heap by 1MB (without moving the original memory block) and repopulate it all with "a."
| Note |
I decided on Windows because it is the most accessible platform. Everyone and his brother has at least one Windows box sitting around somewhere. The documentation for Windows is better also. Linux and BSD variants tend to require a little more investment in terms of the learning curve, so I decided on Windows in an effort to keep the audience as broad as possible.
|
If you value portability above more direct access to the kernel, you could probably get away with using malloc() to allocate yourself a large "heap," though (see Figure 4.3) this would add an extra layer of code between the memory management that I am going to implement and the operating system.
Keep It Simple...Stupid!
My goal in this chapter is to help you learn how to implement your own manual memory management code. I could have very easily gotten sidetracked with optimization, and my code would have quickly become very hard to read (if not impossible). If you want to see what I mean, go look at the malloc.c code for the Gnu Compiler Collection. It should keep you occupied for a couple of hours, or maybe a day or two.
Hence, I had to strike a balance between performance and comprehension. I have decided, in the interest of keeping the learning threshold low, that I would keep my source code as simple as possible. I will not try to impress you with syntactic acrobatics. Instead, I intend to show you the basic idea so that you can "get it" without seven hours of frustrating rereading. Having perused several malloc() implementations myself, I know how demoralizing it can be to have to decipher optimized code.
I also make the assumption that this chapter's code will be executing in a single-threaded environment. I know that some members of the reading audience may be gasping at my negligence. Again, I want to focus on memory management without being distracted by complicated synchronization issues. Once you have a working knowledge under your belt, you can add all the amenities. I will leave it as an exercise to the reader to make everything thread safe.
Measuring Performance
Given that I have decided to error on the side of simplicity, it would be interesting to see what it costs me in terms of performance relative to a commercial implementation of malloc() and free(). Although marketing people will barrage you with all sorts of obscure metrics when they are trying to sell you something, measuring performance is really not that complicated, as you will see.
The Ultimate Measure: Time
According to John Hennessy and David Patterson in their book Computer Architecture: A Quantitative Approach, there is one true measure of performance: execution time. In other words, how long did it take for an event to transpire from the moment it started to the moment it completed? Execution time is also known as wall clock time, or response time.
| Note |
There are other measures of performance that you may see in literature, like MIPS (millions of instructions per second) and MFLOPS (million floating-point operations per second), but these are poor metrics that can lead to confusing comparisons. For an explanation of why, see Patterson and Hennessey's book.
|
Naturally, there are ways to slice and dice execution time. You can measure how much time the processor itself spends executing a program. This may be a pertinent value if you are working on a multitasking operating system. If you are executing a program on a machine that is carrying a heavy load of tasks, the program under observation may appear to run more slowly (via wall clock time) even if it is actually running faster.
You can subdivide processor time into how much time the processor spends executing a task in user mode and how much time the processor spends executing a task in kernel mode. Encryption programs spend most of their time in user space crunching numbers, while I/O-intensive programs spend most of their time in kernel space interacting with the hardware.
| Note |
Given that time is such a useful performance metric, what exactly is it? According to Einstein, "Time is that which is measured by a clock." While this is correct, it is not really satisfying. Another possible definition lies in the nature of light; you could define one second as the amount of time it takes a photon in a vacuum to travel 3×10⁸ meters. Again, this still may not give you a concise enough definition. There is a story of a foreign student who once asked a professor at Princeton, "Please, sir, what is time?" The professor responded by saying, "I am afraid I can't tell you; I am a physics professor. Maybe you should ask someone in the philosophy department."
|
Unfortunately, a time measurement in and of itself really doesn't tell you everything. This is because time measurements are context sensitive. Telling someone that a program took 300 milliseconds to execute doesn't give them the entire picture. The execution time of a program is dependent upon many things, including:
-
The hardware that the program ran on
-
The algorithms that the program used
-
The development tools used to build the program
-
The distribution of the data that the program operated on
The time measurements that I collected in this chapter were generated by programs running on a 700 MHz Pentium III. All of the programs were built using Visual Studio 6.0. Each implementation uses a different algorithm in conjunction with a data distribution that, I will admit, is slightly artificial. The system that I worked on was a single-user Windows 2000 machine with a bare minimum number of running tasks.
My hope, however, is not that the individual measurements will mean anything by themselves. Rather, I am more interested in seeing how the different algorithms compare to each other. You should notice a time differential between algorithms, as long as the other three independent variables (hardware, tools, data) are held constant. This time differential is what is important.
ANSI and Native Time Routines
In order to determine the execution time of a program, you will need to take advantage of related library calls. There are two standard ANSI C functions declared in the time.h header file that can be applied to this end:
The time() function returns the number of seconds that have occurred since the epoch. The epoch is an arbitrary reference point; in most cases, it is January 1, 1970 (00:00:00). The problem with the time() function is that it works with time units that do not possess a fine enough granularity. Most important application events occur on the scale of milliseconds, microseconds, or even nanoseconds.
The clock() function returns the number of system clock ticks that have occurred since a process was launched. The number of ticks per second is defined by the CLOCKS_PER_SEC macro. This value will vary from one hardware platform to the next, seeing as how it is a processor-specific value.
The Win32 API provides a routine called GetTickCount() that returns the number of milliseconds that have passed since the operating system was booted. I decided to use this function to time my code. If you are more interested in writing portable code, you might want to use clock().
Here is a short example that demonstrates how all three of these functions are used in practice:
If this program is built and run, the following type of output will be generated:
The Data Distribution: Creating Random Variates
To test the performance of my manual memory managers, I will need to run them through a lengthy series of allocations and deallocations. Naturally, I cannot simply allocate memory blocks that all have the same size.
The previous program does not force a manager to deal with the arbitrary requests that a heap manager normally encounters. This kind of test is unrealistic.
On the other hand, a completely random series of allocations is also not very realistic.
| Note |
Another problem with both of the previous examples is that memory is released in the exact order in which it is allocated. It would be a bad move to assume that this type of behavior could be expected.
|
High-grade memory managers usually try to take advantage of regularities that exist in executing programs. If there are patterns, special steps can be instituted to exploit those patterns and benefit overall performance. Random data destroys regularity. This can lead to incorrect performance evaluations because a memory manager that does successfully take advantage of regularities will not be able to flex its muscles. On the same note, a memory manager that does a poor job of exploiting patterns will be able to hide its weakness behind the random allocation stream.
This leads me to a dilemma. I cannot use a series of fixed-sized memory block requests, and I cannot use a random stream of allocation requests. I need to create a synthetic stream of allocation requests and release requests that are reasonably random but still exhibit a basic element of regularity. The caveat is that, although programs can demonstrate regular behavior, there are an infinite number of programs that a manual memory manager might confront. What type of allocation behavior is the most likely?
This is where I threw my hands up and decided to use a stream of allocation requests that followed a specific discrete probability distribution. This allowed me to weight certain types of memory requests, although it also forced me to decide on a certain type of allocation behavior (i.e., one that might not be realistic).
I decided to use the following discrete probability distribution to model allocation requests:
Table 4.1
|
(x) Size of Allocation in Bytes
|
(P(x)) Probability
|
|
16
|
.15 = p1
|
|
32
|
.20 = p2
|
|
64
|
.35 = p3
|
|
128
|
.20 = p4
|
|
256
|
.02 = p5
|
|
512
|
.04 = p6
|
|
1024
|
.02 = p7
|
|
4096
|
.02 = p8
|
Visually, this looks like what is displayed in Figure 4.4.
I will admit that this distribution is somewhat arbitrary. To actually generate random numbers that obey this distribution, I use an algorithm that is based on what is known as the inverse transform method.
-
Generate a uniform random number, U, between 0 and 1.
-
If U < p1 = .15, set allocation to 16 bytes and go to step 10.
-
If U < p1+p2 = .35, set allocation to 32 bytes and go to step 10.
-
If U < p1+p2+p3 = .70, set allocation to 64 bytes and go to step 10.
-
If U < p1+p2+p3+p4 = .90, set allocation to 128 bytes and go to step 10.
-
If U < p1+p2+p3+p4+p5 = .92, set allocation to 256 bytes and go to step 10.
-
If U < p1+p2+p3+p4+p5+p6 = .96, set allocation to 512 bytes and go to step 10.
-
If U < p1+p2+p3+p4+p5+p6+p7 = .98, set allocation to 1024 bytes and go to step 10.
-
Set allocation to 4096 bytes and go to step 10.
-
Stop.
This algorithm is based on being able to generate a uniform random number between 0 and 1. In other words, I must be able to generate a random number that is equally likely to be anywhere between 0 and 1. To do this, I use the following function:
This code invokes the rand() function located in the C standard library. The rand() function generates what is known as a pseudorandom integer in the range 0 to RAND_MAX. A pseudorandom number is one that is generated by a mathematical formula. A well-known formula for creating random integer values is the Linear Congruential Generator (LCG), which makes use of a recursive relationship:
For example, if we pick a=5, b=3, m=16, and x0=3, we will obtain the following stream of values:
The value x0 is known as the seed. One thing you should know about LCGs is that they eventually begin to repeat themselves. In general, the constants that are chosen (i.e., a, b, and m) make the difference between a good and a bad LCG. According to Knuth, a good LCG is:
Because the formula allows us to determine what the next number is going to be, the numbers are not truly random. However, the formula guarantees that generated values will be evenly distributed between 0 and RAND_MAX, just like a long series of values that are actually uniformly random. The fact that these formula-based numbers are not really random, in the conventional sense, is what led John Von Neumann to proclaim the following in 1951:
"Anyone who considers arithmetical methods of producing random digits is, of course, in a state of sin."
| Note |
The LCG technique for creating random numbers was discovered by Dick Lehmer in 1949. Lehmer was a prominent figure in the field of computational mathematics during the twentieth century. He was involved with the construction of ENIAC, the first digital computer in the United States, and was also the director of the National Bureau of Standards' Institute for Numerical Analysis.
|
Testing Methodology
Each memory manager that I implement will be subjected to two tests: a diagnostic test and a performance test.
If you modify any of the source code that I provide, you may want to run the diagnostic test to make sure that everything still operates correctly. The goal of a diagnostic test is to examine the operation of a component, so it will necessarily execute much more slowly than a performance test. Once a memory manager has passed its diagnostic test, it can be barraged with a performance test.
Performance testing will be executed by an instantiation of the PerformanceTest class. The class is used as follows:
The PerformanceTest class, mentioned in the previous code snippet, has the following implementation:
Depending on the source files that I #include, different versions of newMalloc() and newFree() can be used. I can also replace newMalloc()/newFree() with the native malloc()/free() implementations to get a baseline measurement.
You may notice that I defer time measurement until the last possible moment. I don't start measuring clock ticks until the instant directly before the memory allocation calls start occurring. This is because I don't want to include the time that was spent loading the application, constructing input values, and executing shutdown code.
I will admit that my testing code is synthetic, but my crude approach is motivated by a need to keep my discussion limited. You could fill up several books with an explanation and analysis of more sophisticated performance testing methods. Per my initial design goal (keep it simple ... stupid), I have opted for the path of least resistance.
There are a number of industrial-strength benchmark suites that have been built to provide a more accurate picture of how well a processor or application performs. For example, the TOP500 Supercomputer Sites portal (http://www.top500.org) uses the LINPACK Benchmark to rank high-performance installations. The LINPACK Benchmark tests the horsepower of a system by asking it to solve a dense set of linear equations.
SPEC, the Standard Performance Evaluation Corporation, is a nonprofit corporation registered in California that aims to "establish, maintain, and endorse a standardized set of relevant benchmarks that can be applied to the newest generation of high-performance computers" (quoted from SPEC's bylaws; see http://www.spec.org). SPEC basically sells a number of benchmark suites that can be used to collect performance metrics. For example, SPEC sells a CPU2000 V1.2 package that can be used to benchmark processors. SPEC also sells a JVM98 suite to test the performance of Java virtual machines. If you have $1,800 to spare, you can purchase SPEC's MAIL2000 mail server benchmark suite.
Indexing: The General Approach
For the remainder of this chapter, I will introduce three different ways to manage memory with explicit recycling. All of the approaches that I discuss use techniques that fall into the category of indexing schemes, which is to say that they keep track of free and allocated memory using an indexing data structure. What distinguishes the following three techniques is the type of indexing data structure that they use and how they use it. In each case, I will start with an abstract explanation of how the basic mechanism works. Then I will offer a concrete implementation and take it for a test drive. I will end each discussion with an analysis that looks into the benefits and potential disadvantages of each approach.
malloc() Version 1: Bitmapped Allocation
Theory
The bit map approach uses an array of bits to keep track of which regions of memory are free and which regions are occupied. Memory is broken up into small plots of real estate, and each bit in the bit map represents one of these plots. This is illustrated in Figure 4.5.
The problem with this approach is that the bit map does not indicate how much memory has been allocated for a given region. If you execute a command like
the bit map will not know how much storage to free because a bit map has no place to record how much storage was allocated. All a bit map can do is tell you which regions of memory are free and which are taken. When you allocate the 55 bytes above, a certain number of bits in the bit map will be cleared. However, once this happens, the bit map cannot tell who owns the region and how much memory they control.
This means that we need to augment the bit map with another data structure that will be able to record how much memory is reserved for each allocation. I decided to use a binary search tree (BST) to serve this purpose. These two data structures — the bit map and the binary search tree — complement each other nicely. The bit map is used during the allocation phase to locate a free memory region, and the BST is used during the release phase to determine how many bits in the bit map to reset.
| Note |
In my implementation, I used a set bit (1) to indicate a free region of memory and a clear bit (0) to indicate an occupied region of memory. The choice is arbitrary, but it is important to remember this if you are going to understand my bookkeeping.
|
The best way to prepare you to look at the source is to provide psuedocode for the core memory management algorithms:
-
Translate the number of bytes requested to an equivalent number of bits in the bit map.
-
Look for a run of free bits equal to the value calculated in step 1.
-
If such a run exists, go to step 4; otherwise return NULL.
-
Clear the bits in the bit map to indicate that the associated memory is occupied.
-
Create a BST entry for the allocated memory and insert it into the BST.
-
Return the address of the first byte of the allocated memory.
A run of bits in the bit map is just a sequence of consecutively set or clear bits. With regard to allocation, we are interested in runs of bits that are set (i.e., set to 1).
-
Take the address supplied and use it to index an entry in the BST.
-
If an entry exists, then go to step 3; otherwise stop.
-
Use the information in the BST entry to set bits in the bit map to the "free" state.
Each BST node represents a region of allocated memory. As such, the nodes contain three vital pieces of information. They store the allocated memory's address in the heap. They also store the allocated memory's starting index in the bit map and the number of bits that are utilized in the bit map. This allows the node to take a call from a function like newFree() and map the function's linear address argument to a location in the bit map.
Implementation
The source code implementation of the bit map memory manager is broken up into several files:
Table 4.2
|
File
|
Use
|
|
driver.cpp
|
contains main () , is the scene of the crime
|
|
mallocv1.cpp
|
newMalloc(), newFree() wrappers
|
|
perform. cpp
|
implements the PerformanceTest class
|
|
memmgr.cpp
|
uses bitmap.cpp and tree.cpp to institute a policy
|
|
bitmap.cpp
|
implements the bit map
|
|
tree.cpp
|
implements the BST
|
The tree.cpp and bitmap.cpp files provide the mechanism side of the memory manager. These files contain fairly neutral implementations of a BST and a bit map. The MemoryManager class in memmgr.cpp is what brings these two mechanisms together to institute a working policy.
tree.cpp
The BST implementation is fairly generic:
bitmap.cpp
The BitMap class is also fairly straightforward in its implementation and could be reused for something else:
memmgr.cpp
This source file brings the two previous data structures together to form an actual memory manager, known fittingly as the Memory-Manager class.
mallocV1.cpp
This file supplies wrappers that allow the MemoryManager class to be used under the guise of the newMalloc() and newFree() functions so that existing applications will only have to be slightly modified.
The DEBUG_XXX macros, defined at the top of this file insert, activate a set of debugging printf() statements in each file. For the performance test run, I commented these macros out so that none of the printf() statements made it into the build.
perform.cpp
In addition to the PerformanceTest class described earlier, this file also contains the definition of the PerformanceTestDriver() function that will be called from main().
driver.cpp
This file is where everything comes together. The main() function contains a call to debugTest() and PerformanceTestDriver(). For diagnostic builds, I activate the debug macros in mallocV1.cpp and then comment out the PerformanceTestDriver() function call. For the build that tests performance, I comment out the debug macros and the debugTest() function invocation. The version of driver.cpp below is set up to build an executable that runs a performance test.
Tests
I performed two different tests against this memory manager. A debug test was performed to make sure that the manager was doing what it was supposed to do. If you modify my source code, I would suggest running the debug test again to validate your changes. Once I was sure that the memory manager was operational, I turned off debugging features and ran a performance test.
The debug test was performed by executing the code in the debugTest() function defined in the driver.cpp source file. I keep things fairly simple, but at the same time, I take a good, hard look at what is going on. If you decide to run a debug test, you will want to make sure that the DEBUG_XXX macros in mallocV1.cpp are turned on. You will also want to comment out the PerformanceTestDriver() function call in main().
The following output was generated by the debug build of the memory manager. After every allocation and release, I print out the contents of the bit map and the binary search tree. This provides a state snapshot of the memory manager. Also, the bits in each bit map byte read from left to right (which is to say that the lower order bits are on the left-hand side):
The performance test was nowhere near as extended with regard to the output that it produced. This was primarily because all the debug printf() statements had been precluded from the build. Here is the output generated by the performance test build:
The most important value is located on the last line of the output. The bitmapped memory manager took 856 milliseconds to allocate and free 1024 regions of memory. This will not mean much until we look at the other memory managers.
Trade-Offs
Bit mapped memory managers have the benefit of providing a straightforward way to organize memory that, depending on the bit-to-memory ratio, can minimize internal fragmentation. Many early operating systems used bit maps to help manage memory because bit maps are fixed in size and thus can be placed outside of the chaos of the kernel's dynamic memory pools. For example, if each bit in a bit map represents 16 bytes of memory, a 512KB bit map will be needed to manage 64MB of memory. Although this doesn't include the storage needed for the associated BST, you can see that the overhead isn't that bad.
On the other hand, finding a run of free bits in a bit map means that you may have to traverse the entire set of bits to find what you are looking for (assuming that you do find it). This mandatory searching makes allocation very expensive in terms of execution time.
If I had to improve this code, I would replace the binary search tree with a tree data structure that is guaranteed to be well-balanced. As you can see from the debug output, the binary tree that was formed was worst-case unbalanced (and that's an understatement). This is more a function of the request stream than of anything else.
I would also tackle the code in the BitMap class that traverses the bit map data structure. Most of my BitMap member function implementations are based on brute force iteration. There are some circumstances where I could skip needless iteration by being a little more skillful with implied starting points. For example, it is obvious that the 18th bit will be in the third byte of the bit map, so there is no need to cycle through the first two bytes of the map.
Finally, another weak point of my implementation is that it cannot grow. The memory manager described in this section starts off with a fixed amount of heap memory, and that is all that it gets. A production-quality memory manager would be able to increase its pool of storage by making a request to the underlying operating system.
malloc() Version 2: Sequential Fit
Back in the early 1990s, I was experimenting with DOS in an effort to see how malloc() and free() were implemented by Borland's Turbo C libraries.
Here is the program that I used:
I compiled this using the following command line: C:\dos> tcc-mh dmalloc.c.
I specified a "huge" memory model (via the -mh option) so that addresses would be specified in the segment:offset real mode format.
This program produced the following output while running on DOS:
As you can see, the libraries give each allocation its own 48-bit block. It is more than likely that the extra 16 bytes is used by the Turbo C malloc() and free() libraries to link the regions of memory together into a linked list. This is a key feature of the sequential fit approach to memory management.
Theory
The sequential fit technique organizes memory into a linear linked list of free and reserved regions (see Figure 4.7). When an allocation request occurs, the memory manager moves sequentially through the list until it finds a free block of memory that can service/fit the request (hence the name "sequential fit").
Typically, an external data structure is not needed because portions of the allocated memory are reserved so that the memory being managed can index itself. Logically, the blocks of memory are arranged as in Figure 4.7. However, the actual organization of each block, be it free or reserved, in my implementation is specified by Figure 4.8.
The scheme for allocation is pretty simple; the memory manager simply traverses the linked list of memory blocks until it reaches a free block that is big enough to satisfy the request. If the free block is much larger than the memory request, it will split the free block into two pieces. One part of the split block will be used to service the request, and the other part will remain free to service other requests for memory (see Figure 4.9).
The algorithm for releasing blocks of memory requires adjacent blocks of free memory to be merged. This is where the real work occurs. For a block situated between two other blocks, there are basically four different scenarios that are possible (see Figure 4.10).
The trick is to be able to reassign the NEXT and PREVIOUS pointers, shown in Figure 4.7, correctly. If both blocks on either side of a freed block are occupied, no pointer manipulation needs to be performed. However, if one or both of the adjacent blocks is free, blocks of memory will need to be merged.
The best way to understand this is visually. Figure 4.11 shows an example of the pointer manipulation that needs to be performed in order to merge two adjacent blocks.
For a rigorous explanation of how memory block merging works, read the source code of the SequentialFitMemoryManager class.
Implementation
Because storage space in the heap is used to help organize heap memory, the sequential fit memory manager implementation is not as prolific as the bit map-based manager. My implementation requires only four files:
Table 4.3
|
File
|
Use
|
|
driver.cpp
|
contains main(), is the scene of the crime
|
|
mallocV2.cpp
|
newMalloc(), newFree() wrappers (2nd version)
|
|
perform.cpp
|
implements the PerformanceTest class
|
|
memmgr.cpp
|
implements the SequentialFitMemoryManager class
|
memmgr.cpp
The majority of the real work is performed by the class defined in this file. The SequentialFitMemoryManager class takes care of allocating heap storage from Windows and managing it. Both the allocation and release functions have secondary private helper routines. The allocation function uses a helper function to split free blocks. The release function calls a helper function to perform the actual merging of free memory blocks.
 #ifdef  DEBUG_SF_MEM_MGR
 #define MSG0(arg);            printf(arg);
 #define MSG1(arg1,arg2);      printf(arg1,arg2);
 #else
 #define MSG0(arg);
 #define MSG1(arg1,arg2);
 #endif

 #define U1 unsigned char
 #define U4 unsigned long

 /*
     list element format
                 |0  3||4  7|| 8  ||9 12||13 .. n|
                 [PREV][NEXT][STATE][SIZE][payload]
                   U4    U4    U1     U4     ?

     byte allocated/freed is address of first byte of payload
     header = 13 bytes

     byte[0] is occupied by header data, so is always used, thus
             first link has prev=0 ( 0 indicates not used )
             last link has next=0
 */

 #define PREV(i)        (*((U4*)(&ram[i-13])))
 #define NEXT(i)        (*((U4*)(&ram[i-9])))
 #define STATE(i)       (*((U1*)(&ram[i-5])))  /*FREE,OCCUPIED*/
 #define SIZE(i)        (*((U4*)(&ram[i-4])))

 #define FREE                0
 #define OCCUPIED            1
 char *stateStr[3]={"FREE","OCCUPIED"};

 #define START        13    /*address of first payload*/
 #define SZ_HEADER    13

 class SequentialFitMemoryManager
 {
     private:
     HANDLE handle;
     U1  *ram;    /*memory storage*/
     U4  size;

     void split(U4 addr,U4 nbytes);
     void merge(U4 prev,U4 current,U4 next);

     public:

     SequentialFitMemoryManager(U4 nbytes);
     ~SequentialFitMemoryManager();
     void*allocate(U4 nbytes);
     void release(void* addr);
     void printState();
 };

 SequentialFitMemoryManager::SequentialFitMemoryManager(U4
           nbytes)
 {
     handle = GetProcessHeap();
     if(handle==NULL)
     {
         printf("SequentialFitMemoryManager::");
         printf("SequentialFitMemoryManager():");
         printf("invalid handle\n");
         exit(1);
     }

     ram = (U1*)HeapAlloc(handle,HEAP_ZERO_MEMORY,nbytes);

     //for portability, you could use:
     //ram = (unsigned char*)malloc(nbytes);


     size = nbytes;

     if(size<=SZ_HEADER)
     {
         printf("SequentialFitMemoryManager::");
         printf("SequentialFitMemoryManager():");
         printf("not enough memory fed to constructor\n");
         exit(1);
     }

     PREV(START)=0;
     NEXT(START)=0;
     STATE(START)=FREE;
     SIZE(START)=size-SZ_HEADER;

     MSG0("SequentialFitMemoryManager::");
     MSG1("SequentialFitMemoryManager(%lu)\n", nbytes);

     return;

 } /*end constructor----------------------------------------------------*/

 SequentialFitMemoryManager::~SequentialFitMemoryManager()
 {
     if(HeapFree(handle,HEAP_NO_SERIALIZE,ram)==0)
     {
         printf("SequentialFitMemoryManager::");
         printf("~SequentialFitMemoryManager():");
         printf("could not free heap storage\n");
         return;
     }

     //for portability, you could use:
     //free(ram);

     MSG0("SequentialFitMemoryManager::");
     MSG0("~SequentialFitMemoryManager()");
     MSG1("free ram[%lu]\n",size);
     return;

 }/*end destructor--------------------------------------------*/

 /*
 U4 nbytes    -    number of bytes required
 returns address of first byte of memory region allocated
 ( or NULL if cannot allocate a large enough block )
 */

 void* SequentialFitMemoryManager::allocate(U4 nbytes)
 {
     U4 current;

     MSG0("SequentialFitMemoryManager::");
     MSG1("allocate(%lu)\n",nbytes);

     if(nbytes==0)
     {
         MSG0("SequentialFitMemoryManager::");
         MSG0("allocate(): zero bytes requested\n");
         return(NULL);
     }

     //traverse the linked list, starting with first element

     current = START;
     while(NEXT(current)!=0)
     {
         if((SIZE(current)>=nbytes)&&(STATE(current)==FREE))
         {
             split(current,nbytes);
             return((void*)&ram[current]);
         }
         current = NEXT(current);
     }

     //handle the last block ( which has NEXT(current)=0 )

     if((SIZE(current)>=nbytes)&&(STATE(current)==FREE))
     {
         split(current,nbytes);
         return((void*)&ram[current]);
     }

     return(NULL);

 }/*end allocation----------------------------------------------*/

 /*
 breaks [free] region into [alloc] [free] pair, if possible
 */

 void SequentialFitMemoryManager::split(U4 addr, U4 nbytes)
 {
     /*
     want payload to have enough room for
     nbytes = size of request
     SZ_HEADER = header for new region
     SZ_HEADER = payload for new region (arbitrary 13 bytes)
     */

     if(SIZE(addr)>= nbytes+SZ_HEADER+SZ_HEADER)
     {
         U4 oldnext;
         U4 oldprev;
         U4 oldsize;

         U4 newaddr;

         MSG0("SequentialFitMemoryManager::");
         MSG0("split():split=YES\n");

         oldnext=NEXT(addr);
         oldprev=PREV(addr);
         oldsize=SIZE(addr);

         newaddr = addr + nbytes + SZ_HEADER;

         NEXT(addr)=newaddr;
         PREV(addr)=oldprev;
         STATE(addr)=OCCUPIED;
         SIZE(addr)=nbytes;

         NEXT(newaddr)=oldnext;
         PREV(newaddr)=addr;
         STATE(newaddr)=FREE;
         SIZE(newaddr)=oldsize-nbytes-SZ_HEADER;
     }
     else
     {
         MSG0("SequentialFitMemoryManager::");
         MSG0("split(): split=NO\n");
         STATE(addr)=OCCUPIED;
     }
     return;

 }/*end split----------------------------------------*/

 void SequentialFitMemoryManager::release(void *addr)
 {
     U4 free;    //index into ram[]

     if(addr==NULL)
     {
         MSG0("SequentialFitMemoryManager::");
         MSG0("release(): cannot release NULL pointer\n");
         return;
     }

     MSG0("SequentialFitMemoryManager::");
     MSG1("release(%lu)\n",addr);

     //perform sanity check to make sure address is kosher

     if( (addr>= (void*)&ram[size]) || (addr< (void*)&ram[0]) )
     {
         MSG0("SequentialFitMemoryManager::");
         MSG0("release(): address out of bounds\n");
         return;
     }

     //translate void* addr to index in ram[]

     free = (U4)( ((U1*)addr) - &ram[0]);

     MSG0("SequentialFitMemoryManager::");
     MSG1("address resolves to index %lu\n",free);

     //a header always occupies first 13 bytes of storage

     if (free<13)
     {
          MSG0("SequentialFitMemoryManager::");
          MSG0("release(): address in first 13 bytes\n");
          return;
     }

     //yet more sanity checks

     if((STATE(free)!=OCCUPIED)    ||  //region if free
        (PREV(free)>=free)   ||  //previous element not previous
        (NEXT(free)>=size)   ||  //next is beyond the end
        (SIZE(free)>=size)   ||  //size region greater than whole
        (SIZE(free)==0))         //no size at all
     {
         MSG0("SequentialFitMemoryManager::");
         MSG0("release(): referencing invalid region\n");
         return;
     }

     merge(PREV(free),free,NEXT(free));

     return;

 }/*end release---------------------------------------------*/

 /*
        4 cases ( F=free O=occupied )
            FOF -> [F]
            OOF -> O[F]
            FOO -> [F]O
            OOO -> OFO
 */

 void SequentialFitMemoryManager::merge(U4 prev,U4 current,U4
             next)
 {
     /*
     first handle special cases of region at end(s)
     prev=0                    low end
     next=0                    high end
     prev=0 and next=0     only 1 list element
     */

     if(prev==0)
     {
         if(next==0)
         {
             STATE(current)=FREE;
         }
         else if(STATE(next)==OCCUPIED)
         {
             STATE(current)=FREE;
         }
         else if(STATE(next)==FREE)
         {
             U4 temp;

             MSG0("SequentialFitMemoryManager::merge():");
             MSG0("merging to NEXT\n");
             STATE(current)=FREE;
             SIZE(current)=SIZE(current)+SIZE(next)+SZ_HEADER;
             NEXT(current)=NEXT(next);

             temp = NEXT(next);
             PREV(temp)=current;
         }
     }
     else if(next==0)
     {
         if(STATE(prev)==OCCUPIED)
         {
             STATE(current)=FREE;
         }
         else if(STATE(prev)==FREE)
         {
             MSG0("SequentialFitMemoryManager::merge():");
             MSG0("merging to PREV\n");
             SIZE(prev)=SIZE(prev)+SIZE(current)+SZ_HEADER;
             NEXT(prev)=NEXT(current);
         }
     }

     /* now we handle 4 cases */

     else if((STATE(prev)==OCCUPIED)&&(STATE(next)==OCCUPIED))
     {
         STATE(current)=FREE;
     }
     else if((STATE(prev)==OCCUPIED)&&(STATE(next)==FREE))
     {
         U4 temp;

         MSG0("SequentialFitMemoryManager::merge():");
         MSG0("merging to NEXT\n");
         STATE(current)=FREE;
         SIZE(current)=SIZE(current)+SIZE(next)+SZ_HEADER;
         NEXT(current)=NEXT(next);

         temp = NEXT(next);
         if(temp!=0){ PREV(temp)=current; }
     }
     else if((STATE(prev)==FREE)&&(STATE(next)==OCCUPIED))
     {
         MSG0("SequentialFitMemoryManager::merge():");
         MSG0("merging to PREV\n");
         SIZE(prev)=SIZE(prev)+SIZE(current)+SZ_HEADER;
         NEXT(prev)=NEXT(current);
         PREV(next)=prev;
     }
     else if((STATE(prev)==FREE)&&(STATE(next)==FREE))
     {
         U4 temp;

         MSG0("SequentialFitMemoryManager::merge():");
         MSG0("merging with both sides\n");
         SIZE(prev)=SIZE(prev)+
                    SIZE(current)+SZ_HEADER+
                    SIZE(next)+SZ_HEADER;
         NEXT(prev)=NEXT(next);

         temp = NEXT(next);
         if(temp!=0){ PREV(temp)=prev; }
     }

     return;

 }/*end merge----------------------------------------------*/

 void SequentialFitMemoryManager::printState()
 {
     U4 i;
     U4 current;

     i=0;
     current=START;

     while(NEXT(current)!=0)
     {
         printf("%lu) [P=%lu]",i,PREV(current));
         printf("[addr=%lu]",current);
         printf("[St=%s]",stateStr[STATE(current)]);
         printf("[Sz=%lu]",SIZE(current));
         printf("[N=%lu]\n",NEXT(current));
         current = NEXT(current);
         i++;
     }

     //print the last list element

     printf("%lu) [P=%lu]",i,PREV(current));
     printf("[addr=%lu]",current);
     printf("[St=%s]",stateStr[STATE(current)]);
     printf("[Sz=%lu]",SIZE(current));
     printf("[N=%lu]\n",NEXT(current));

     return;

 }/*end printState---------------------------------------------------------------*/
mallocV2.cpp
There were several minor alterations to this file, most notably the presence of a different set of debugging macros. To activate debugging code, uncomment the macros and compile a new build.
driver.cpp
As in the last example, this file contains the main() function definition that invokes the testing code. The debugTest() was completely rewritten for this implementation. The PerformanceTestDriver() function, defined in perform.cpp that makes use of the PerformanceTest class, has been left untouched.
Tests
If you look at the main() function defined in driver.cpp, you will see that I performed both a debug test and a performance test. I performed a debug test to make sure that the manager was doing what it was supposed to do. If you modify my source code, I would suggest running the debug test again to validate your changes. Once I was sure that the memory manager was operational, I turned off debugging features and ran a performance test.
The debug test is fairly simple, but at the same time, I would take a good, hard look at what is going on. If you decide to run a debug test, you will want to make sure that the DEBUG_XXX macros in mallocV2.cpp are turned on. You will also want to comment out the PerformanceTestDriver() function call in main().
The following output was generated by the debug build of the memory manager:
Although it may seem a tad tedious, it will help you tremendously to read the debugTest() function and then step through the previous output. It will give you an insight into what the code is doing and how the particulars are implemented.
The performance test was conducted by commenting out debugTest() and the debug macros in mallocV2.cpp, and then enabling the PerformanceTestDriver() function. The results of the performance run were interesting:
As you can see, the performance increase is dramatic.
Trade-Offs
The sequential fit approach solves many of the problems that plagued the bitmapped approach by using an indexing scheme that decreased redundant effort. Instead of manually sifting through each bit in a bit map, we were able to use a series of pointers to find what we needed much more quickly.
While the sequential fit technique did exhibit far better performance than the bit map technique, we were only using a 270-byte heap. For much larger heaps, such as a 15MB heap, the amount of time needed to traverse a sequential linked list from beginning to end can hurt performance. Thus, the sequential fit method is not exactly a scalable solution.
In terms of choosing a memory block to allocate, I use what is known as the first-fit policy, which is to say that my implementation uses the first satisfactory block of memory that it finds. There are other policies, like next-fit, best-fit, and worst-fit.
The first-fit policy tends to cause the blocks of memory at the start of the linked list to splinter into a number of smaller blocks. Given that the sequential fit algorithm traverses the list starting from the beginning during an allocation, this can hurt execution time.
The next-fit policy is like the first-fit policy, but the memory manager keeps track of the position of the last allocation. When the next allocation request is processed, the manager will start traversing the linked list from the point of the last allocation. This is done in an attempt to avoid re-traversing the beginning of the list.
The best-fit policy traverses the linked list of memory blocks and uses the smallest possible block that will satisfy an allocation request. The best-fit approach does not waste memory and minimizes internal fragmentation. In doing so, however, the policy tends to generate significant external fragmentation. The search for a "best" block can also be expensive in terms of execution time because several possible blocks may have to be located and compared.
The worst-fit policy is instituted by having the memory manager allocate the largest possible memory block for a given request. This policy aims at minimizing external fragmentation. It also does a good job of eliminating large memory blocks so that the memory manager will fail when a request for a large block is submitted.
malloc() Version 3: Segregated Lists
Theory
With the sequential fit approach, we spent a lot of effort in terms of splitting and merging blocks of memory. The segregated lists approach attempts to sidestep this problem by keeping several lists of fixed-sized memory blocks. In other words, the heap storage is segregated into groups of blocks based on their size. If you need a 32-byte block, query the appropriate list for free space instead of traversing the entire heap.
In my segregated list implementation, I break memory into 6,136-byte rows, where each row consists of eight different blocks of memory. This is illustrated in Figure 4.12. The size of the first element in each row is 16 bytes, and the size of the last element in each row is 4,096 bytes.
Because the list elements are fixed in size, and their positions are known, we do not need the PREVIOUS, FREE, and SIZE header fields that were used in the sequential fit scheme. However, we do need the STATE header field. This causes every plot of real estate in memory to be prefixed by a header that is a single byte in size.
Each 6,136-byte row of memory contains eight memory blocks that increase in size (see Figure 4.13). Given that rows are stacked on top of each other in memory, as displayed in Figure 4.12, to get to the next element of a specific size, take the index of a given element and add 6,136 to it.
Implementation
The implementation of the segregated memory manager closely mirrors the implementation of the sequential fit manager:
Table 4.4
|
File
|
Use
|
|
driver.cpp
|
contains main(), is the scene of the crime
|
|
mallocV3.cpp
|
newMalloc(), newFree() wrappers (3rd version)
|
|
perform.cpp
|
implements the PerformanceTest class
|
|
memmgr.cpp
|
implements the SegregatedMemoryManager class
|
The only files that I had to modify were the mallocV3.cpp file and the memmgr.cpp file.
memmgr.cpp
The majority of the real work is performed by the class defined in this file. The SegregatedMemoryManager class takes care of allocating heap storage from Windows and managing it. The allocation function uses a helper function to search through the free lists. The release function does everything by itself.
mallocV3.cpp
There were several minor alterations to this file, most notably the presence of a different set of debugging macros. To activate debugging code, uncomment the macros and compile a new build.
Tests
If you look at the main() function defined in driver.cpp, you will see that I performed both a debug test and a performance test. I performed a debug test to make sure the manager was doing what it was supposed to do. If you modify my source code, I would suggest running the debug test again to validate your changes. Once I was sure that the memory manager was operational, I turned off debugging features and ran a performance test.
The debug test is fairly simple, but at the same time, I would take a good, hard look at what is going on. If you decide to run a debug test, you will want to make sure that the DEBUG_XXX macros in mallocV3.cpp are turned on. You will also want to comment out the PerformanceTestDriver() function call in main().
The following output was generated by the debug build of the memory manager:
Although it may seem a tad tedious, it will help you tremendously to read the debugTest() function and then step through the previous output. It will give you an insight into what the code is doing and how the particulars are implemented.
The performance test was conducted by commenting out debugTest() and the debug macros in mallocV3.cpp, and then enabling the PerformanceTestDriver() function. The results of the performance run were:
Trade-Offs
Compared to the sequential fit technique, the segregated list implementation is blazing fast. However, this does not come without a cost. The segregated list approach demands a large initial down payment of memory. The fact that only certain block sizes are provided can also lead to severe internal fragmentation. For example, a 1,024-byte block could end up being used to service a 32-byte request.
Another issue resulting from fixed block sizes is that there is a distinct ceiling placed on the size of the memory region that can be allocated. In my implementation, you cannot allocate a block larger than 4,096 bytes. If, for some reason, you need a 4,097-byte block of memory, you are plain out of luck. There are variations of my segregated list approach, such as the buddy system, that allow certain forms of splitting and merging to deal with this size-limit problem.
Performance Comparison
Let us revisit all three of the previous implementations. In each of the performance tests, the resident memory manager was given 1MB of storage and was asked to service 1,024 consecutive memory allocation/release operations. The score card is provided in Table 4.5.
Table 4.5
|
Manager
|
Milliseconds
|
|
bitmapped
|
856
|
|
sequential fit
|
35
|
|
segregated list
|
5
|
By a long shot, the bitmapped memory manager was the worst. Now you know why almost nobody uses it. The segregated memory manager outperformed the sequential fit memory manager. However, there are significant trade-offs that might make the sequential fit method preferable to the segregated list method.
One common theme you will see in your journey through computer science is the storage-versus-speed trade-off. If you increase the amount of available memory storage, you can usually make something run faster.
Here is an example: If you rewrite all of the functions in a program as inline macros, you can increase the speed at which the program executes. This is because the processor doesn't have to waste time jumping around to different memory locations. In addition, because execution will not frequently jump to a nonlocal spot in memory, the processor will be able to spend much of its time executing code in the cache.
Likewise, you can make a program smaller by isolating every bit of redundant code and placing it in its own function. While this will decrease the total number of machine instructions, this tactic will make a program slower because not only does the processor spend most of its time jumping around memory, but the processor's cache will also need to be constantly refreshed.
This is the type of situation that we face with the segregated list and sequential fit approaches. The segregated list approach is much faster, but it also wastes a lot of memory. The sequential fit algorithm, on the other hand, decreases the amount of wasted storage at the expense of execution time. This leads me to think that the segregated list approach would be useful for embedded systems that do not typically have much memory to spend. The segregated storage approach might be suited for large enterprise servers that are running high-performance transaction processing software.
|
| http:www.iakovlev. | http:www.iakovlev.orgimages1.gif
2011-07-22 13:35:59 | |
|
|

 LINUX
LINUX 
 Books
Books